Uranium is like any commodity; its price is dictated by supply and demand. There is, however, always a narrative that goes along with the quantitative analysis that needs to be explored. Numbers are great, but in this highly politicized world economy, the numbers don’t tell the whole story.
The basic uranium supply and demand figures were covered in the previous 2 reports. The focus of this report, therefore, will be to outline 3 different scenarios that are affected by 6 situations that I will outline.
For perspective on the potential outcomes of these situations, I believe it’s necessary to represent the effect that each situation has on uranium demand in terms of +/- U3O8 tonnes.
Before we can proceed, we need to calculate the average amount of uranium consumed by one of the world’s nuclear reactors. Considering there are so many different operational parameters for the various reactor types, I believe this calculation is the simplest way to compute their average uranium consumption, regardless of reactor type.
Source: World Nuclear Association
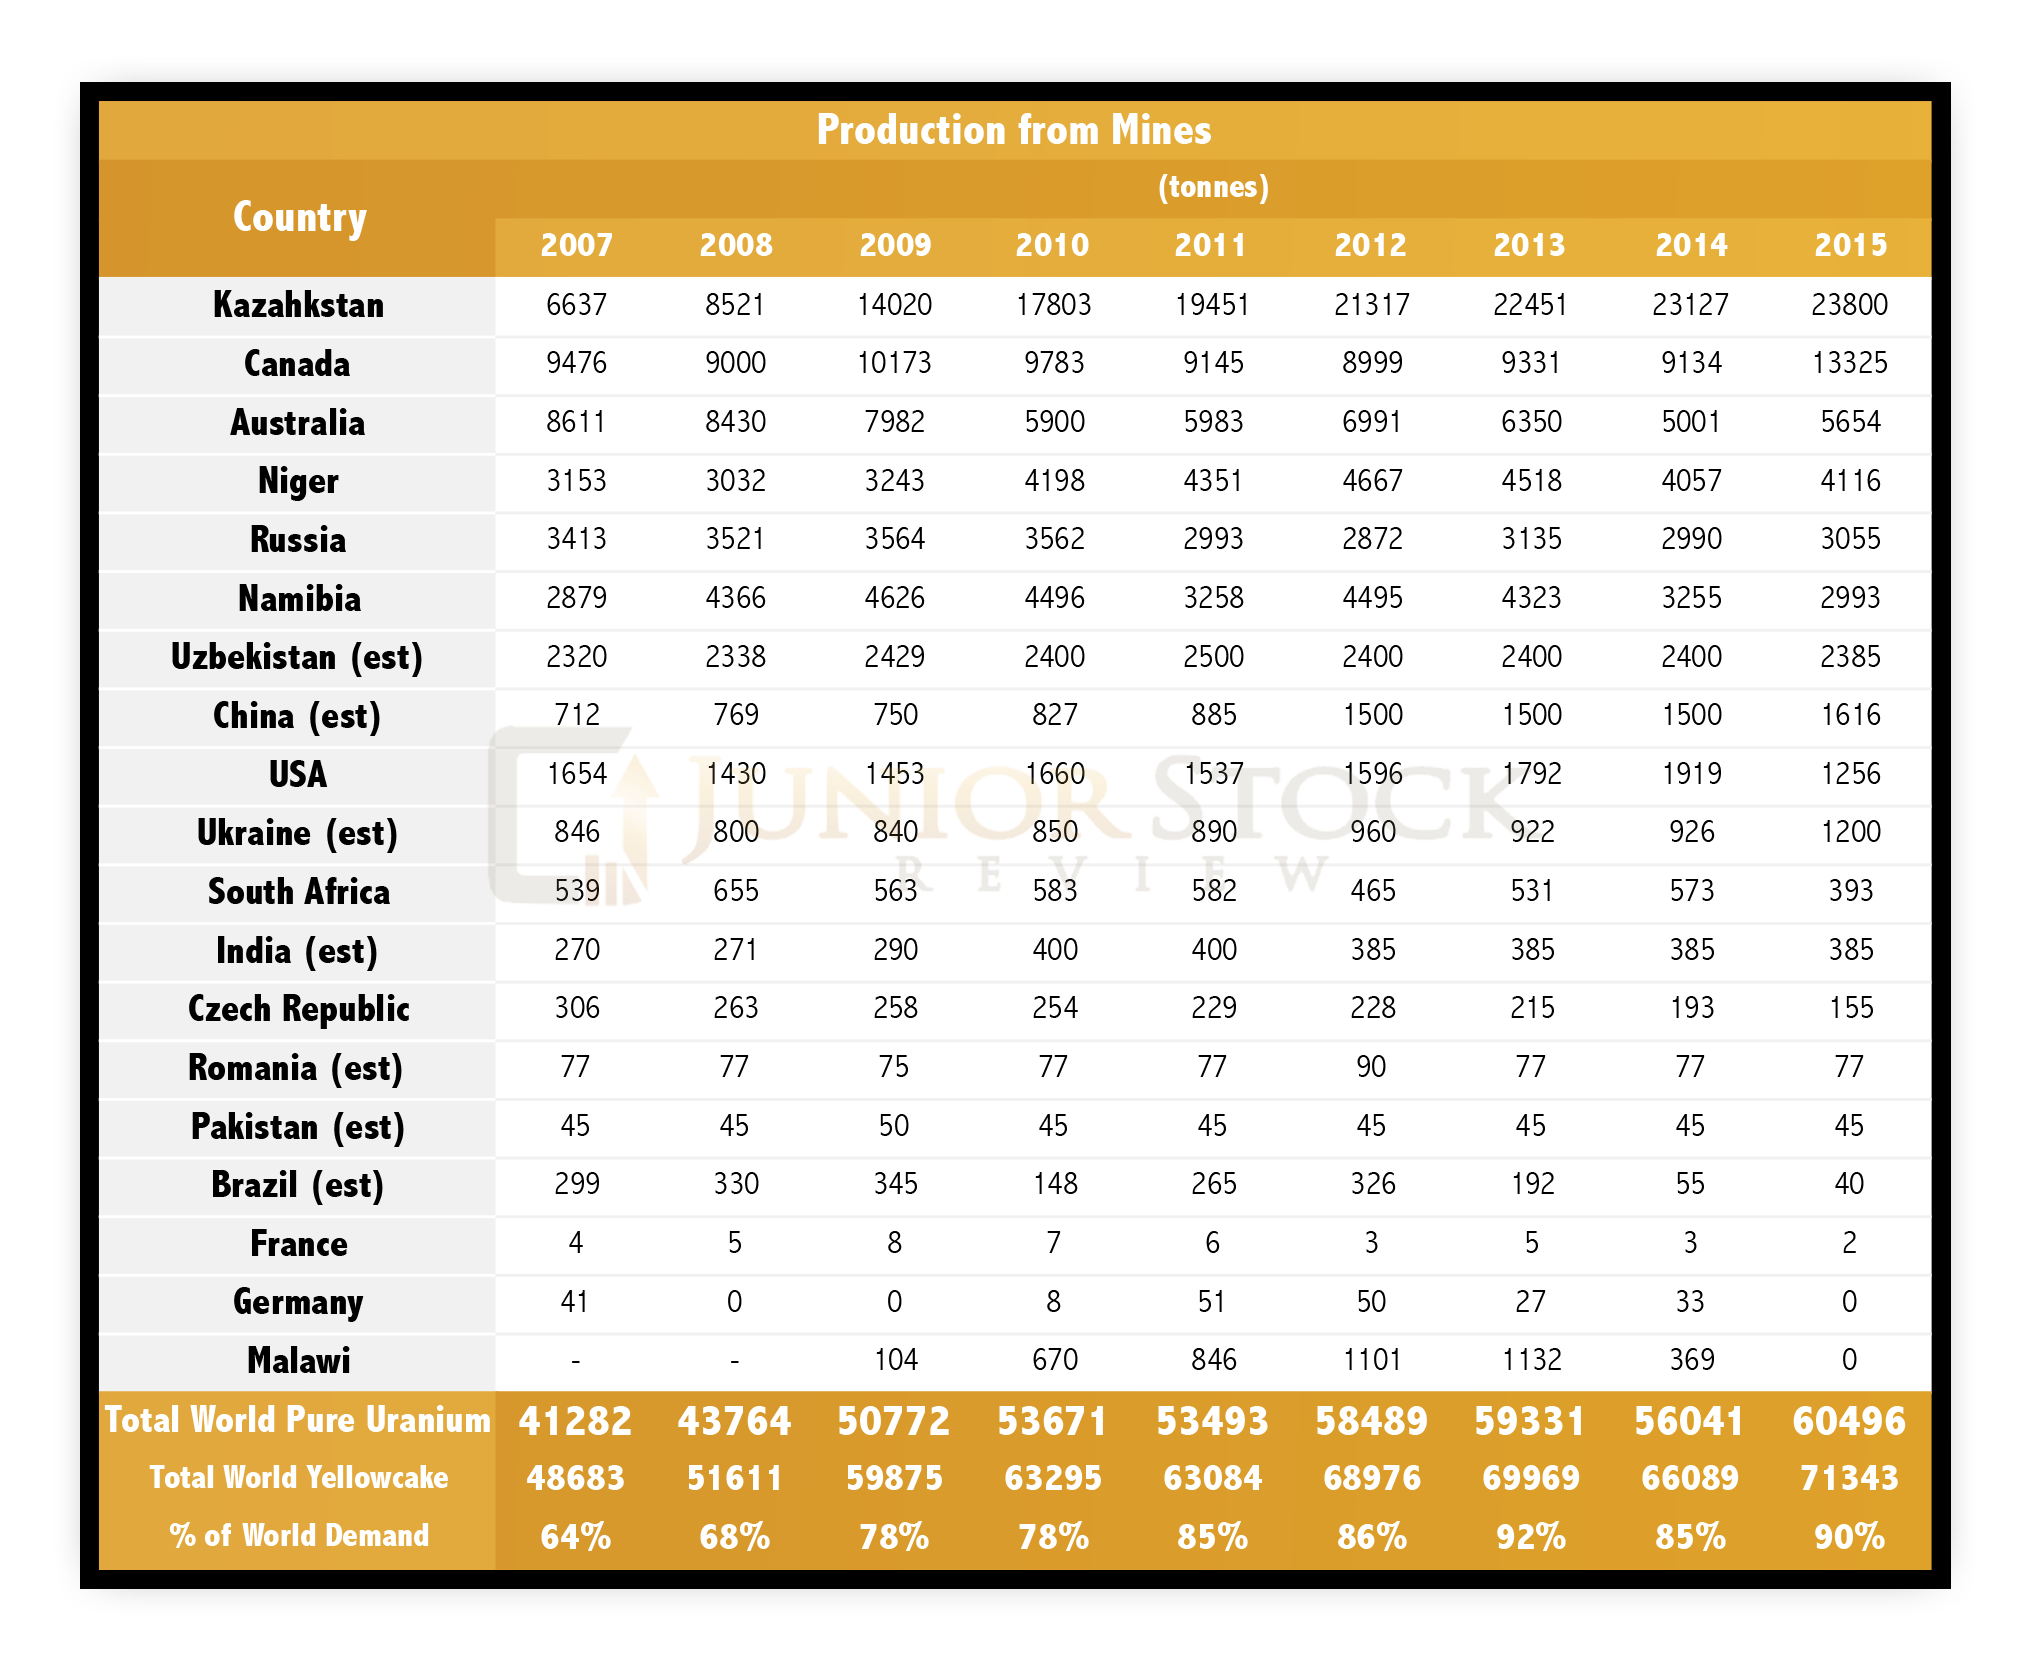
From Part 2 of the series, The Uranium Supply Story, the World Nuclear Association states that in 2015, 71,343 tonnes of U3O8 was produced by the world’s mines. (World Nuclear Association)
- This U3O8 represents 90% of the world’s demand, therefore, the total nuclear fuel needs, expressed in-terms U3O8 can be calculated:
- Total U3O8 tonnes = 71,343 / 0.9 = 79,270 tonnes
The World Nuclear Association says that there are currently 447 operable nuclear reactors in the world (see The Uranium Supply Story for the reactor table). (World Nuclear Association)
- Therefore, a rough calculation of the amount of U3O8 consumed by the average reactor in the world is:
- Average Reactor Consumption = 79,270 / 447 = 177.3 tonnes U3O8
Japan – Post Fukushima
On March 11 2011, an earthquake struck 130 km off the east coast of Japan, registering 9.0 on the Richter scale. The quake set the stage for a massive 15m high tsunami that engulfed Japan’s coastline. The water flooded the Fukushima Daiichi nuclear reactors that sat a paltry 4m above sea level. The flooding led to the over-heating of the reactors and a nuclear emergency was declared for the region. While the reactor meltdown didn’t account for any deaths, the tsunami death toll was close to 19,000 people, and infrastructure and thousands of homes were destroyed in an area that stretched 560 square kilometres.
This disaster forced the Japanese government to suspend operation in their remaining nuclear reactors and, as of November 2016, it’s still somewhat up in the air. As reported by Reuters on October 16, 2016, Ryuichi Yoneyama’s win as Niigata Governor is thought to be a “setback for Prime Minister Shinzo Abe’s energy policy, which relies on rebooting reactors that once met about 30 percent of the nation’s needs.”
In the same Reuters article, Yoneyama states, “As I have promised all of you, under current circumstances where we can’t protect your lives and your way of life, I declare clearly that I can’t approve a restart,” in reference to the nuclear reactor restarts.
Outside of this political wrinkle, the Japanese have applied to the Nuclear Regulation Authority (NRA) for the re-start of their nuclear reactors. When operable, Japan’s reactors account for close to 30% of their electricity needs. In total, there are 42 reactors with 2 currently under construction. (World Nuclear Association)
Using the world’s average reactor consumption, therefore, re-starting the Japanese reactors should have a positive uranium demand impact of:
- 177.3 tonnes x 42 = 7,448 tonnes U3O8
- If, in 2015, the world total U308 demand was 71,343 tonnes, the 7,448 t of Japanese demand represents an increase of 10.4%.
Nuclear Reactors Under Construction
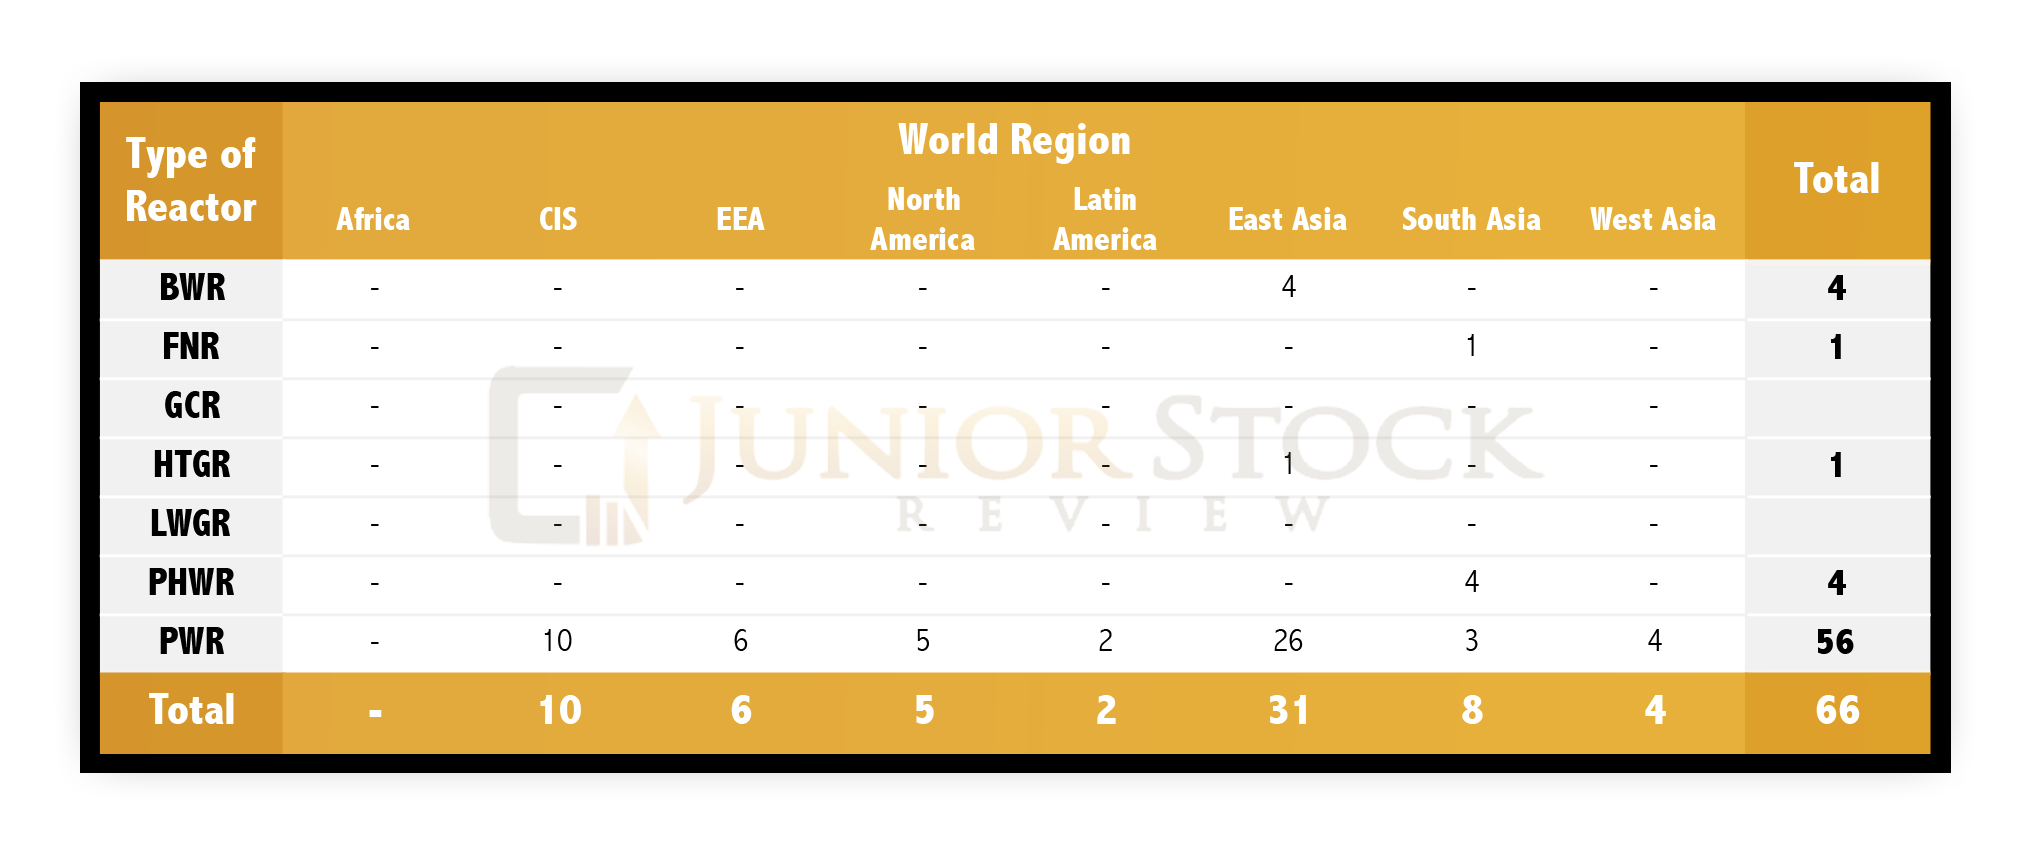
Currently, there are 66 nuclear reactors under construction around the world. The Asian nations lead the pack with 65% or 43 of the reactors under construction. The Chinese possess 20 of these reactors, as they work to achieve cleaner air in their mega cities, while maintaining a reliable supply of base load electricity.
These reactors won’t come online simultaneously, but for the sake of this situation, I’m going to go with Cameco and say that 2/3 of the reactors (Cameco Corporate Presentation) will come online in the next 2 to 3 years. Reviewing data from the last 65 years in the World Nuclear Association’s reactor database, it’s also pretty typical for plants to close; 160 reactors have been permanently shut down or put into long-term shutdown. On average, therefore, 2.5 reactors are shut down each year.
Using the world’s average reactor consumption, new reactor demand should have a positive uranium demand impact of:
- 177.3 tonnes x 66 = 11,701.8 tonnes U3O8
- 11,701.8 x 2/3 = 7,801 tonnes U3O8
- Shutdown plant negative impact = 2.5 (3 years) x 177.7 tonnes = 1,329 tonnes U3O8
- Therefore, 7,801 – 1,329 = 6,472 t U3O8
- If, in 2015, the world total U3O8 production was 71,343 tonnes, 6,472 t of new reactor demand represents an increase of 9.1%
World Electricity Demand
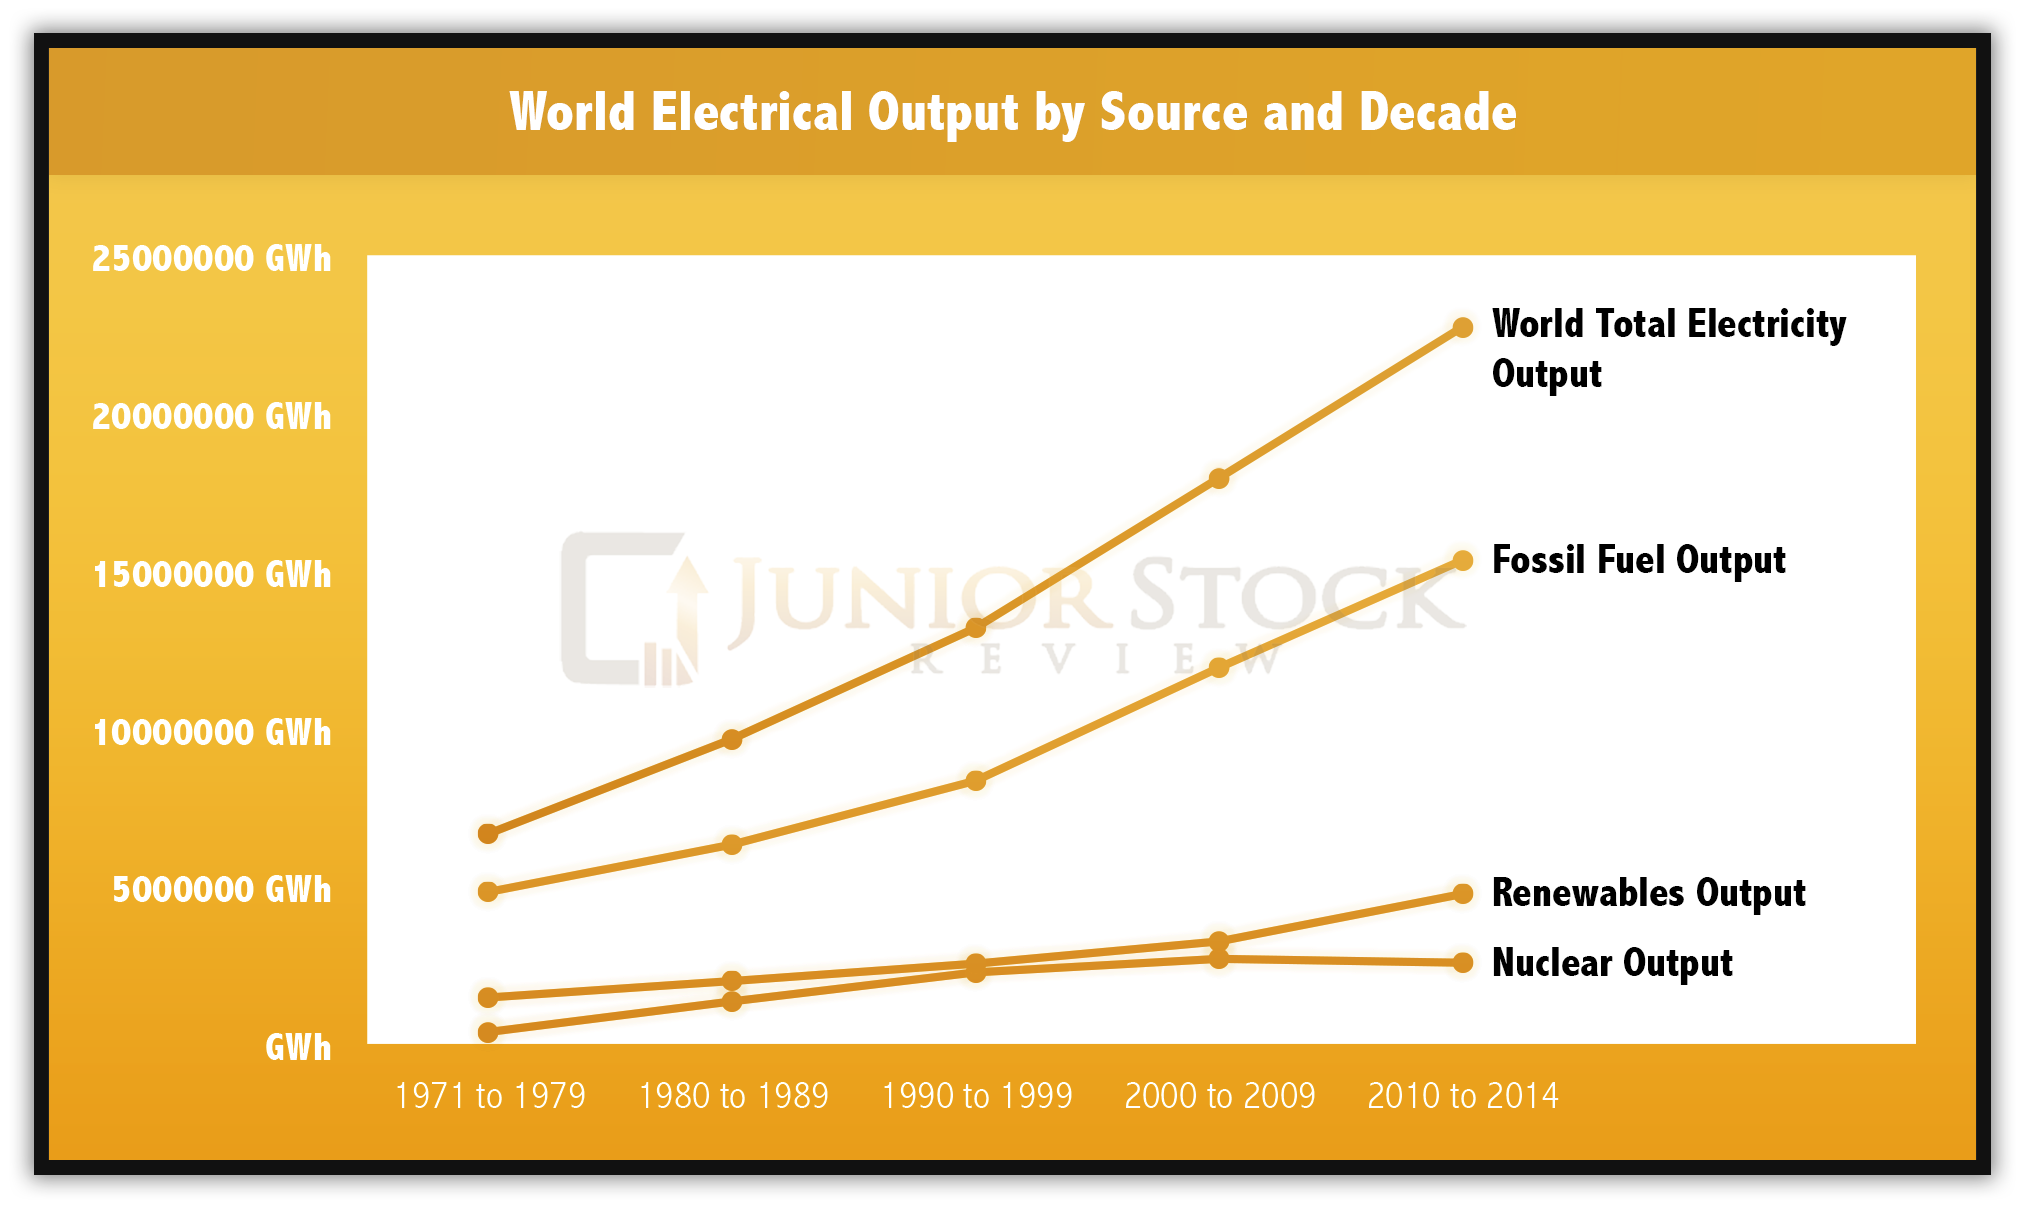
Summarized from: International Energy Agency (IEA)
As you can see from the graph, the world’s demand for electricity continues to rise, even in the face of global economic turmoil. World nuclear reactors generated, 2,535 TWh of electricity in 2014, which was 10.6% of the world’s electricity production. The 2,535 TWh of power translated into a global U3O8 demand of 66,089 tonnes in 2014.
- Hypothetical Situation – Electricity demand grows / nuclear power’s contribution remains the same
- From 2009 to 2014, world electricity output grew, on average, by 732 TWh or 3.4% each year. (IEA)
- We will use a 3.4% Compound Annual Growth Rate (CAGR) in electricity demand from 2015 to 2019.

Source: Investopedia
Global Electrical Demand in 2017 = 26,329 TWh
Global Electrical Demand in 2018 = 27,224 TWh
Global Electrical Demand in 2019 = 28,150 TWh
Finally, 10.6% of 26,329 TWh is 2,791 TWh, which means that using the relation of power generation to U3O8 demand laid out in 2014, 2017’s U3O8 demand would be 72,754 t.
- 2017 demand = (2791 x 66081)/2535 = 72,754 t
Using the same relation, 2018 and 2019 U3O8 demand would be 75,223 t and 77,785 t respectively.
Therefore, using the 2014 relationship between U3O8 production to nuclear power output, and provided that a 3.4% CAGR in global electricity output is achieved, the following differential is found:
- Comparing the calculated U3O8 demand to 2015 production, each year: 2017 = 1,411 t, 2018 = 3,880 t, and 2019 = 6,442 t
- Cumulative over the 3 years = 11,733 t U3O8
MOX Fuel
World Nuclear Association outlines MOX fuel creation, what is easily one of the most contested stages of the nuclear fuel cycle, as “provides almost 5% of the new nuclear fuel used today.” The reason for the worry? Critics believe that if weapons grade plutonium and highly enriched uranium (HEU) are being delivered around the world, it could fall into the wrong hands and be used in an act of terrorism. While this concern may have some validity, it hasn’t been an issue, thus far.
Source: World Nuclear Association
Alternatively, I believe the biggest threat to MOX fuel production is the risk of war. In recent weeks, as outlined in Uranium Demand – Part 3A, the relationship between the Russians and Americans continues to be rocky. Russian President, Vladamir Putin’s comments may just be posturing, but I think that for the purposes of this report, we should consider that Russia will no longer be converting nuclear weapons through down blending.
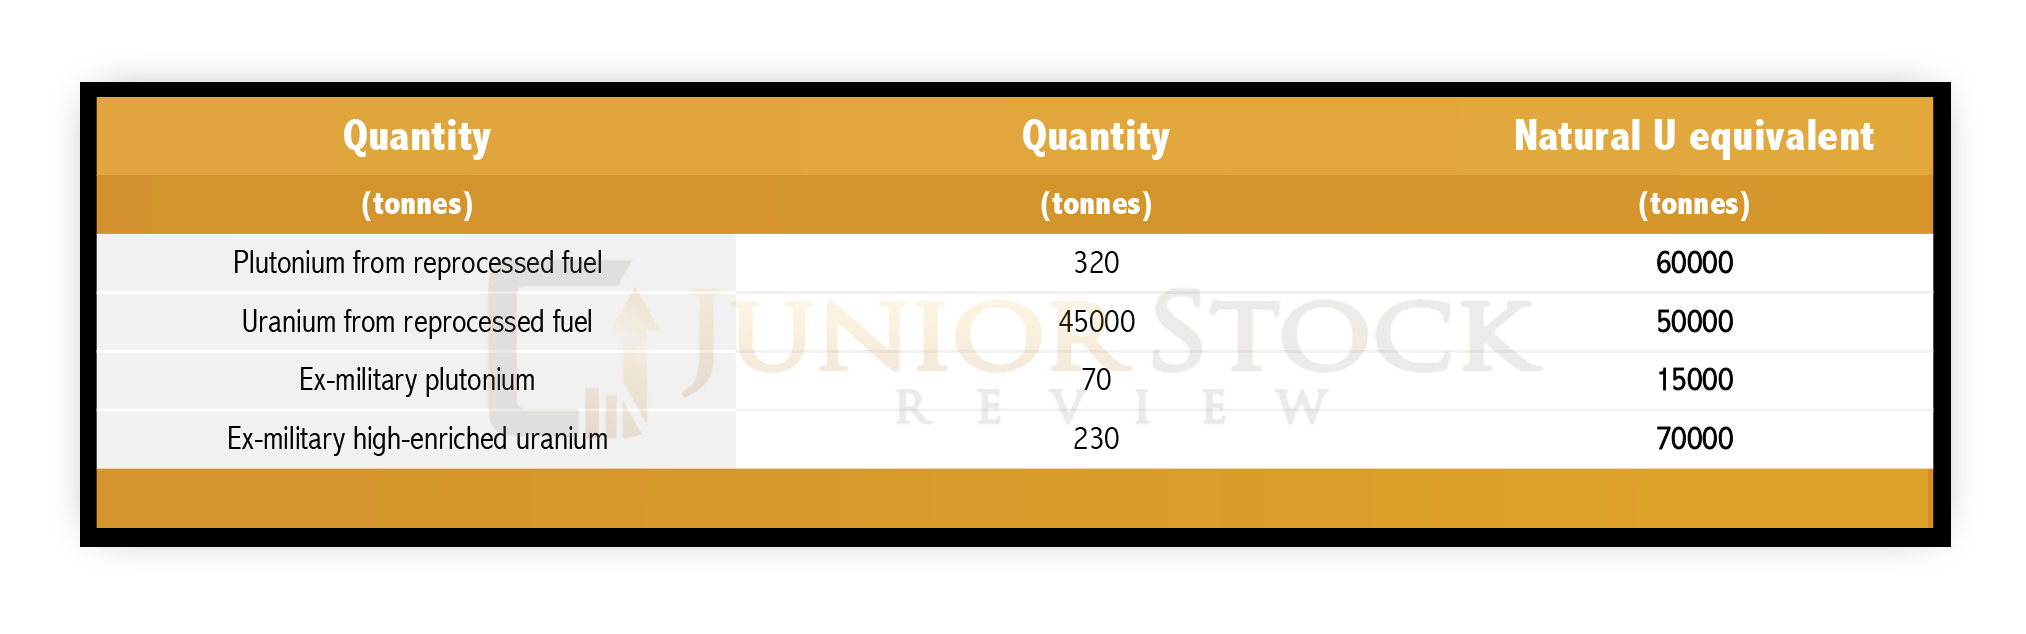
For countries like France, this will have a major impact, as MOX fuel makes up approximately 30% of their nuclear fuel consumption. As can be seen in the tables below, France really is the major consumer of weapons grade plutonium.
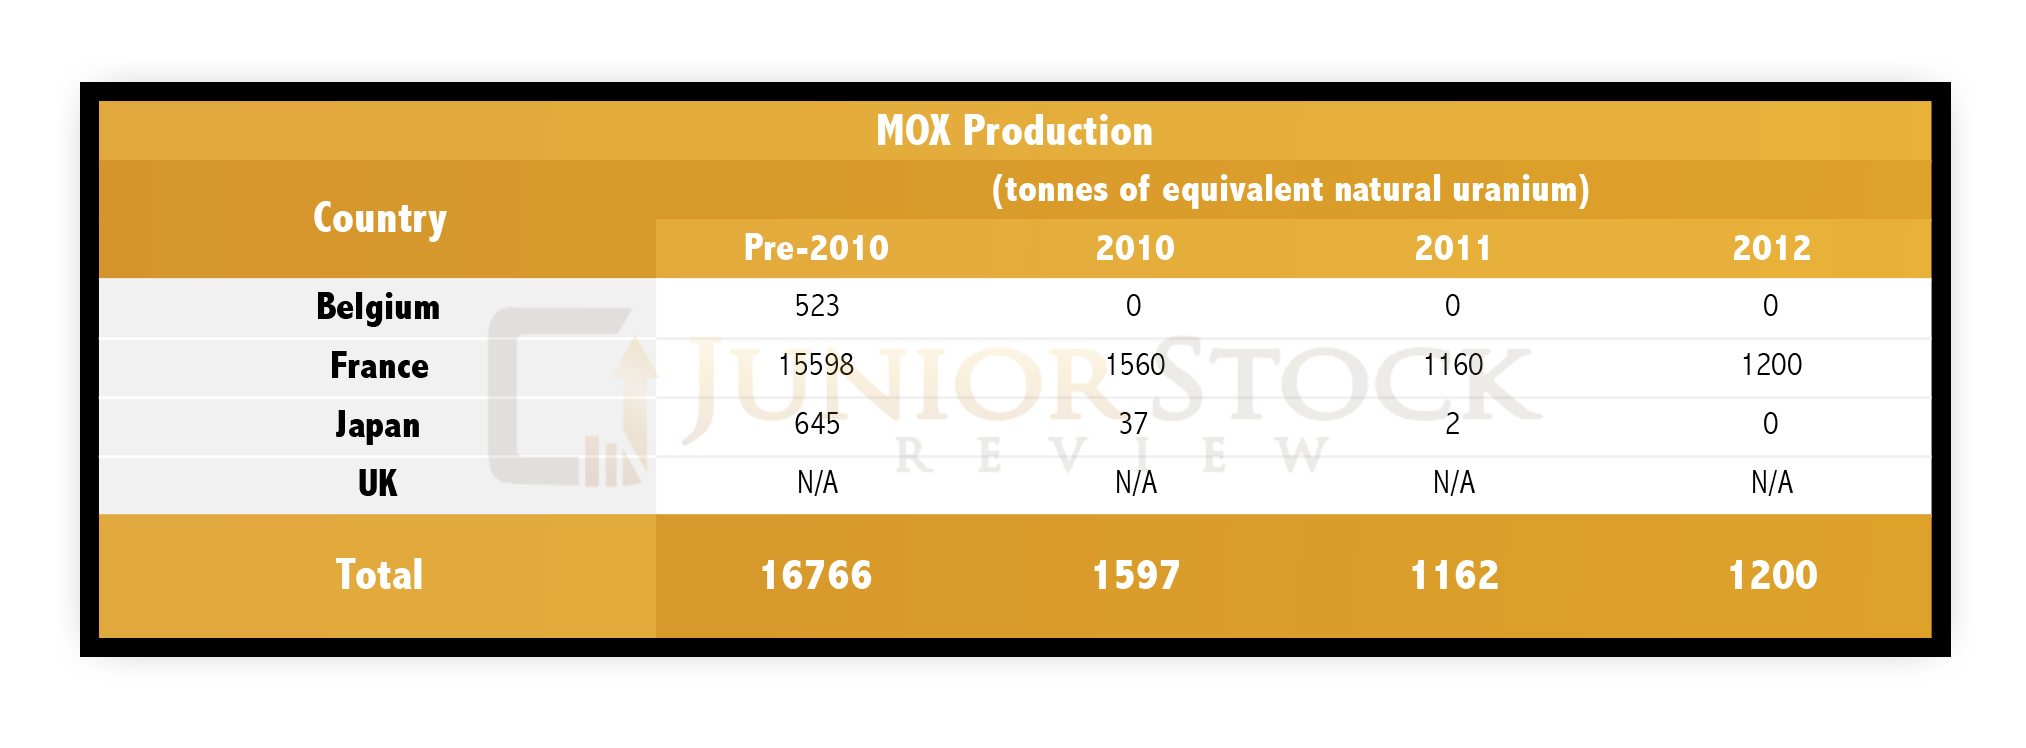
Source: Uranium 2014: RESOURCES, PRODUCTION AND DEMAND, NEA No. 7209 (Red Book)
Currently, the Americans are constructing a MOX fuel fabrication facility (MFFF) in Savannah River, South Carolina. This site, however, isn’t slated for production until 2019, and is designed to process 3.5 t/yr of weapons grade plutonium.
NOTE: Plutonium is a by-product of the nuclear reactor process, making the weapons grade materials not the only source for MOX fuel.
For this calculation, weapons grade plutonium and HEU are removed from the uranium market and MOX fuel production is cut in half.
- If the total 2015 uranium market demand was 79,270 t U3O8, and we will assume that MOX fuel makes up 4.5%, its contribution is equal to 3,567 t U3O8.
- Removing half of the MOX fuel contribution leaves uranium mine production to make up the other half, which would be 1,784 t U3O8
The Trump Effect for America and the Rest of the World
Time will tell how Donald Trump, U.S. president elect, executes the platform he presented during the presidential campaign. For good or ill, politicians have a reputation of not following through on what they promise, so in Trump’s case, we’ll have to wait and see.
In my mind, the uranium market could be affected in a few ways. Firstly, I think that Trump’s position on nuclear weapons could create tension around the world. Most notably, given the stance that Putin has already taken, claiming that America has failed to hold up their end of the nuclear weapons disarmament agreement (BBC), Trump’s bravado could aggravate him further.
The New York Time’s article, Obama Rebukes Donald Trump’s Comments on Nuclear Weapons, published on April 1 2016, reveals a few interesting comments from Trump.
The New York Times summarized and quoted Trump’s comments in reference to Japan and South Korea possessing nuclear weapons, and the possible use of nuclear weapons in a military conflict in Europe:
“Mr. Trump said he was open to allowing Japan and South Korea to acquire nuclear weapons to deter their rogue neighbor, North Korea. He also declined to rule out using nuclear weapons in a military conflict in Europe, saying, ‘You don’t want to, say, take everything off the table.’ ” ~ New York Time’s article
In my mind, this could solidify Russia’s suspension of weapons graded plutonium and HEU down blending. Going a step further, growing tensions with Russia could lead to issues with former Soviet States, Kazakhstan and Uzbekistan, who collectively produced 26,185 t uranium in 2015 – this represents more than 40% of the world’s production. Removing or placing restrictions on this production would have a MAJOR impact on U3O8 demand throughout the world, leaving more than a handful of nations scrambling for nuclear fuel.
I’m not going to put an impact number on this. You can be the judge of how probable this scenario with Russia could be. In my mind, though, if these Commonwealth of Independent States (CIS) decide to align with Russia in a future dispute, the uranium market will be turned upside down.
Secondly, Trump says his focus is to make America great again. In an interview with The Economist, Trump is summarized and quoted as saying,
“[Trump] would crush Islamic State[s] and send American troops to ‘take the oil’. He would ‘Make America great again’, both militarily and economically, by being a better negotiator than all the ‘dummies’ who represent the country today… ‘[E]very single country that does business with us’ is ripping America off, he says. ‘The money [China] took out of the United States is the greatest theft in the history of our country.’ “
What these comments mean for the future of America’s economy isn’t clear, in my opinion. Further, in an interview with the Washington Post , Trump outlines his theory for the economy and how he will fix it:
“I think we’re sitting on an economic bubble. A financial bubble. … We’re not at 5 percent unemployment. We’re at a number that’s probably into the 20s if you look at the real number. That was a number that was devised, statistically devised, to make politicians – and in particular presidents – look good. And I wouldn’t be getting the kind of massive crowds that I’m getting if the number was a real number.”
“I can fix it. I can fix it pretty quickly. … I would do a tax cut. You have to do a tax cut. Because we’re the highest-taxed nation in the world. But I would start … I would immediately start renegotiating our trade deals with Mexico, China, Japan and all of these countries that are just absolutely destroying us.”
Trump does go into more detail with his plan, citing tax cuts and the renegotiating of treaties with certain countries, but that kind of thing certainly doesn’t happen overnight. If he turns the ship correctly, however, and the U.S. economy begins to boom, this would be a major plus to electricity demand, and in my opinion, great news for uranium.
The Rise of Green Energy
The threat of climate change and fear of nuclear power could lead governments to pursue wind and/or solar power generation as a primary source of energy. These alternative sources of energy are not without their detractors, but if this does indeed end up being the direction for energy production in the future (which, at this point, I don’t agree that it should be), it isn’t going to happen right away, because both fossil fuel and nuclear facilities would have to shut down over time.
In an article posted on the Massachusetts Institute of Technology (MIT) School of Engineering website, an author discusses the question, “How many wind turbines would it take to power all of New York City (NYC)?”
According to Paul Sclavounos, Professor of Mechanical Engineering and Naval Architecture, around 4,000, five megawatt turbines would be required to power NYC. This number is apparently not as big as it could be, as NYC citizens are some of the “greenest Americans, with households averaging 4,200 KWh/year.”
Some physical perspective is given,
“Sclavounos calculates that a windfarm sufficient to power all of New York City would spread over 4,000 square kilometers of offshore terrain — 40 by 40 miles, or a land area roughly equivalent to half of Yellowstone National Park.”
In Ontario, Canada, where I live, wind turbines are a hotly contested topic because a lot of people don’t want to live right next to them. Why? I’ve heard a number of arguments, one of which is that the turbines are purported to emit a low frequency sound that can apparently have negative health effects. Another is their impact on wildlife, an argument which has been successfully used to stop wind turbine installations in at least one region in Ontario. Now, I’m not sure about the validity of these arguments, but I do know that this sentiment has negatively affected real estate prices in the regions where the turbines have been proposed.
Regardless of these concerns, let us calculate a possible impact of replacing nuclear reactors with wind turbines. In the MIT article, in reference to NYC, it stated that,
“The city’s five boroughs, plus Westchester, consumed around 60 thousand gigawatt-hours of electricity last year.”
I don’t believe nuclear power would be completely singled out as the only power source eliminated during the transition to green energy, but for the sake of this calculation, we will assume that nuclear will be replaced with a quarter of that 60,000 GWh, or 15,000 GWh.
- World Nuclear Power Generation – 2,535,000 GWh / # of reactors worldwide – 447 reactors = 5,671 GWh per reactor
- 15,000 GWh / 5,671 GWh/reactor = 2.6 reactors
- 2.6 reactors x 177.3 t U3O8/reactor = 461 t U3O8
The negative yearly impact to global uranium demand, however, would be 461 t of U3O8.
In all, I have reviewed 6 situations that will have an impact on the future demand of uranium. The following section will summarize these situations into 3 scenarios, each with a different outcome.
Scenario #1
This scenario most closely reflects the world that we currently live in. If you believe that things will stay the same, I’m betting this is what uranium demand looks like in the future. Remember that the uranium demand I have calculated for each situation is along a 1 to 3 year timeline.
- Japan re-starts its nuclear reactors
- New reactors come online
- World economy remains flat
- Trump effect on America and the world is null
- No change in electrical demand
- World politics remain the same
- MOX fuel production remains the same
- Green energy moves forward, removing some fossil fuel and nuclear capacity in certain countries

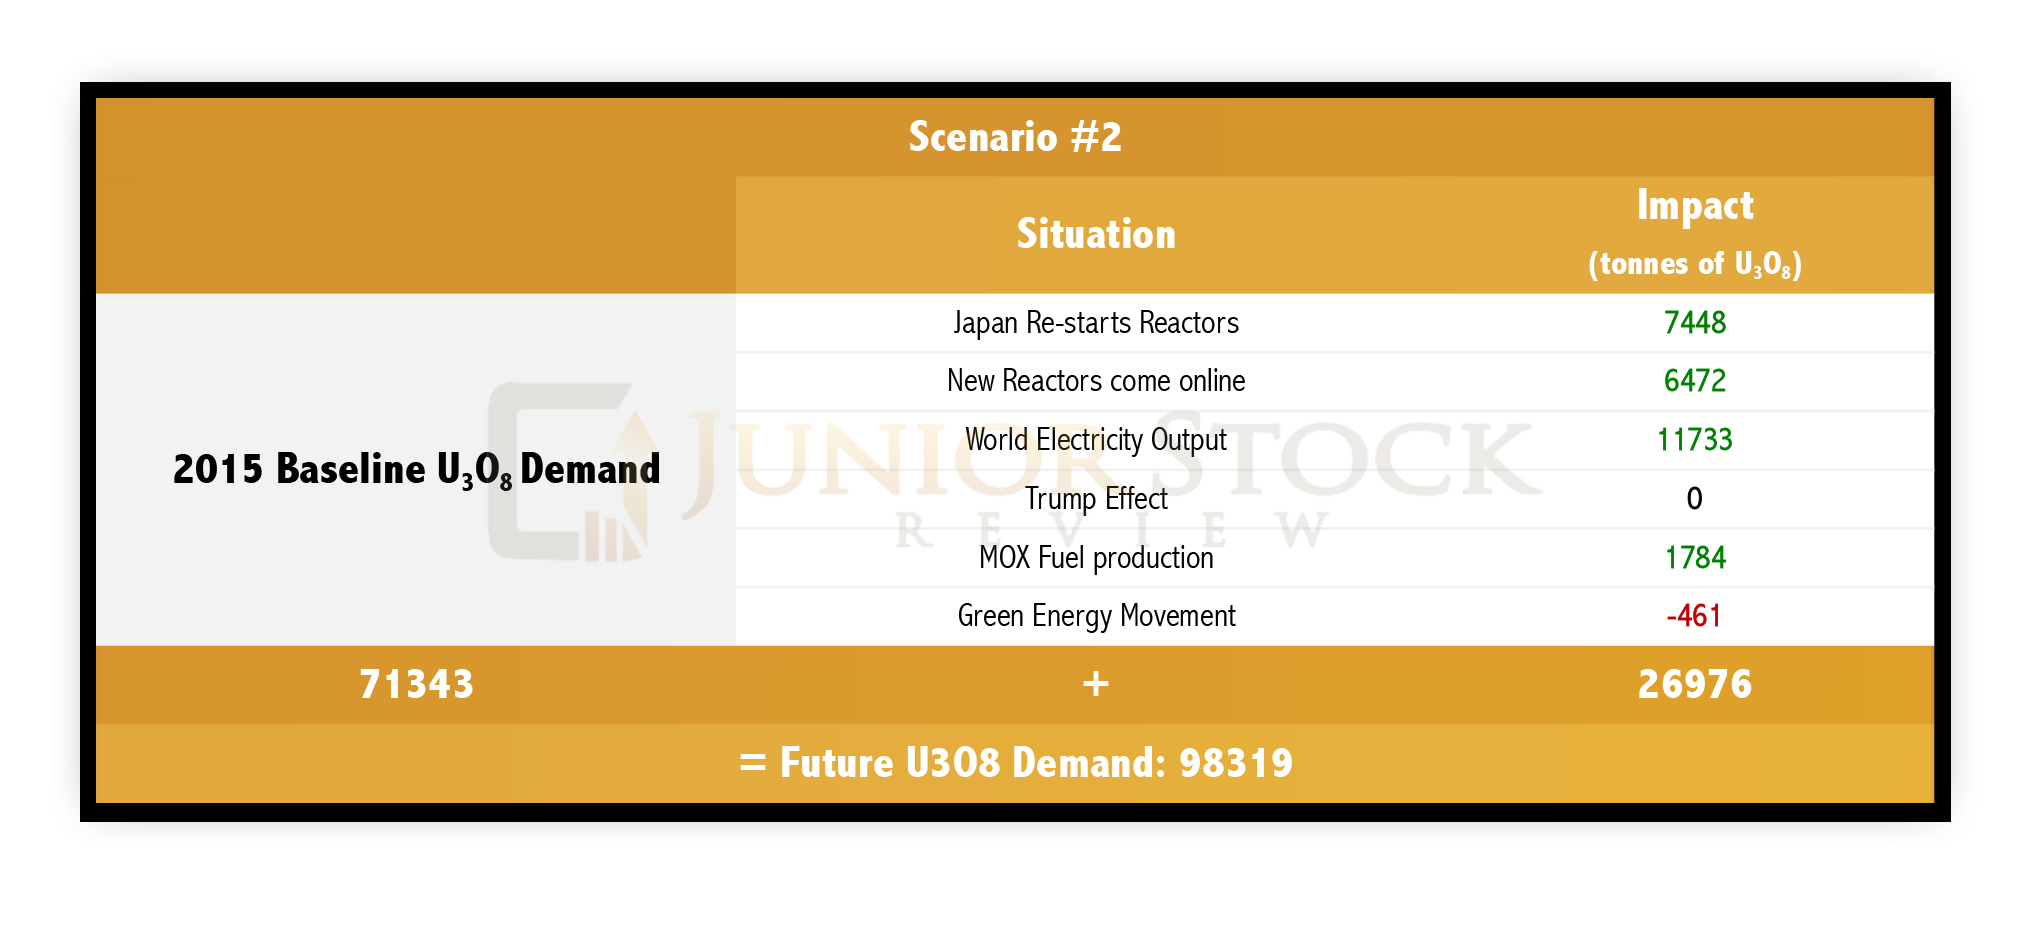
Scenario #2
This scenario reflects a world that is seeing growth due to a boom in the United States, but has come at a price; increased tensions amongst the world powers. The effect on uranium demand, and I’m borrowing from Trump, is gonna be HUGE!
- Japan re-starts its nuclear reactors
- New reactors come online
- World economy grows
- Electrical demand grows at 3.4%
- Trump effect is felt worldwide
- American economy is boosted, but tensions have risen with Russia and many others, as Trump looks to make America great again
- MOX fuel production is cut by 50% as nuclear weapons are once again the military conflict deterrents of choice
- Green energy moves forward, removing some fossil fuel and nuclear capacity in certain countries
Scenario #3
This scenario reflects a world that is in a state of chaos, as the Trump effect has blown up – in a bad way. Tensions have hit a peak and it looks like we are headed for war. Former Soviet nations have banned together, some by choice and some not, to remove their uranium producing resources from the open market. Global uranium producers, such as Cameco, are scrambling, and more importantly, many countries are scrambling for a source of nuclear fuel.
- Japan re-starts its nuclear reactors
- New reactor construction is paused
- World economy stagnates
- Electrical demand, which was initially boosted by the U.S. economy, has since fallen because the world faces war
- Trump effect is felt worldwide
- Tensions have hit their peaks
- MOX fuel production is cut by 50% as nuclear weapons are once again the military conflict deterrents of choice .
- Green energy moves forward, but its rate of inclusion jumps 3 fold, as countries are terrified of quickly diminishing stock piles of fossil fuels and uranium
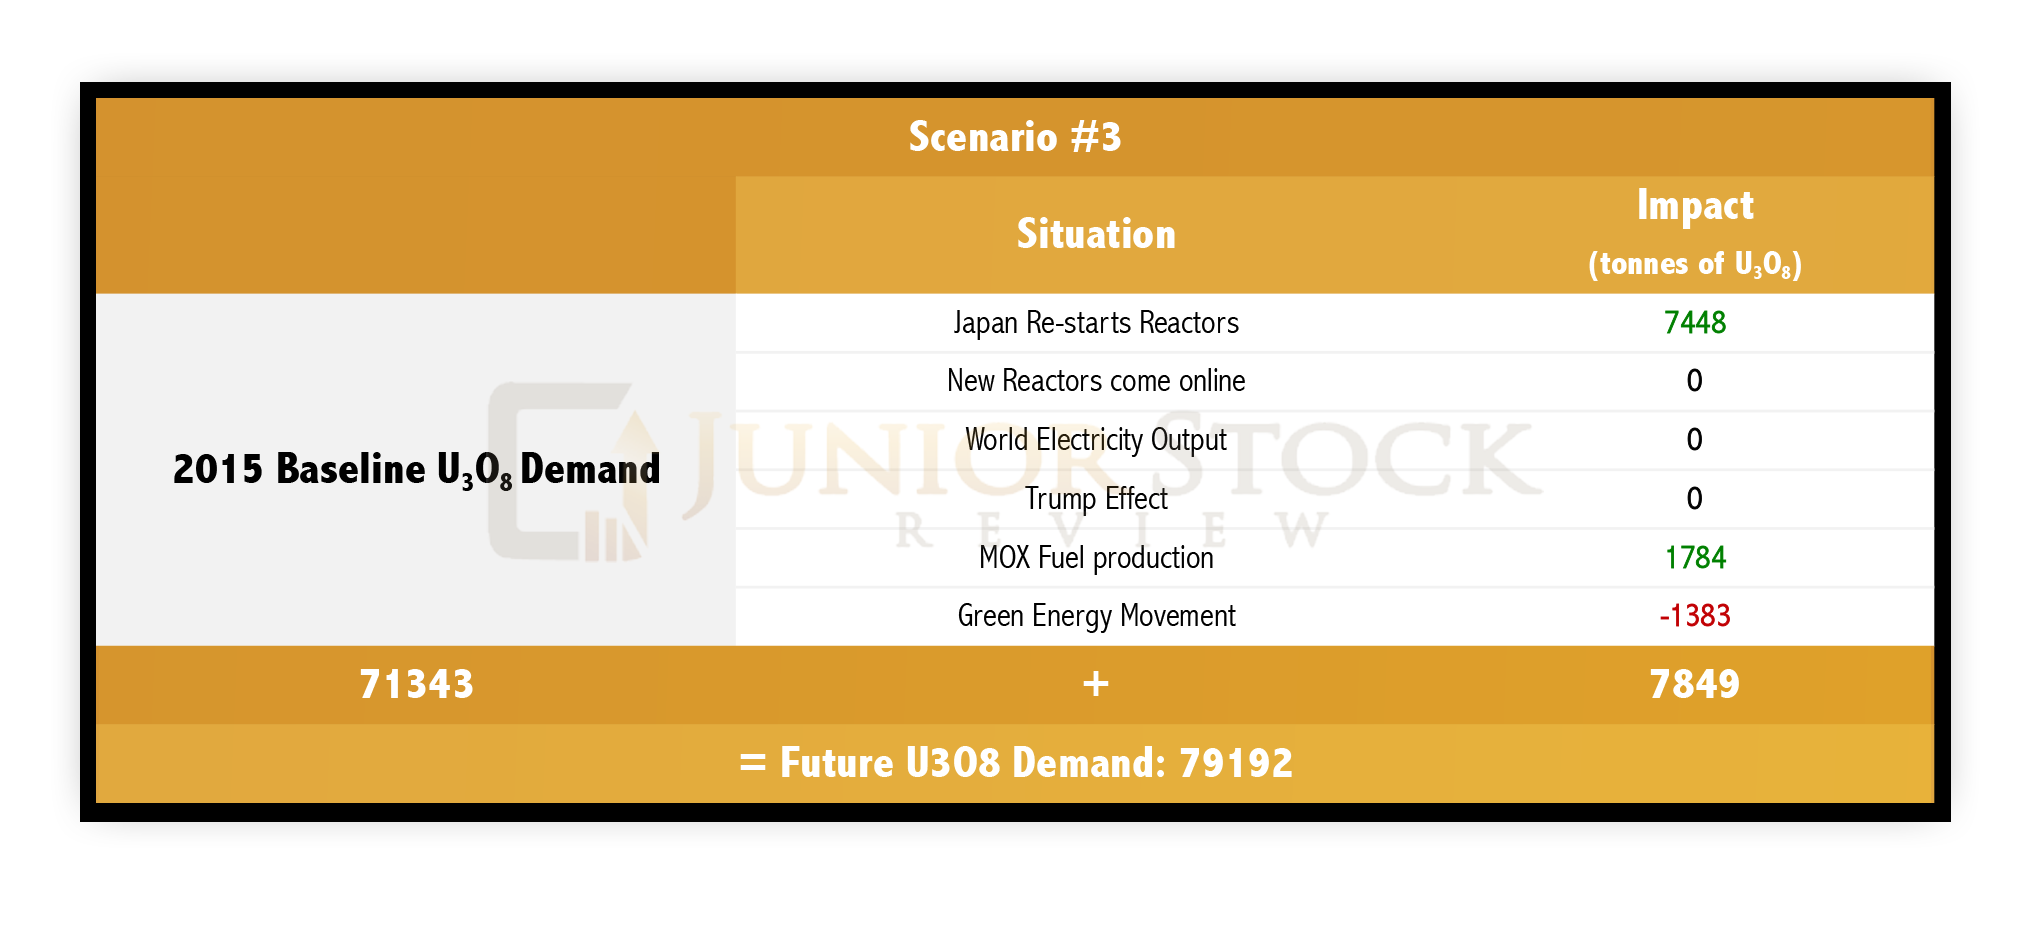
Interestingly, through all of the problems that arise from peak tension, uranium demand is up, and the price, in my mind, at least, could be up MASSIVELY.
To conclude, I’ve presented 3 scenarios that I believe outline possible directions for uranium demand in the years ahead. In all of the situations, almost regardless of what is happening in the world, I see a bright future for uranium. In reality, I think that if people can move past their fear of nuclear power and embrace what are currently incomparable positives, the picture I’ve described for uranium is actually conservative. No emissions, safe and reliable, an energy source worthy of the world’s clean air future.
This wraps up Part 3 of the uranium series. Next up, the companies that I believe are best positioned to be big winners for shareholders in the future uranium bull market.
Until next time,
Brian Leni P.Eng