Posted on

A Conversation with Adventus Zinc Corp. CEO Christian Kargl-Simard

Adventus Zinc Corp


https://www.youtube.com/watch?v=7Q1pWiUa9AQ

Don’t want to miss a new investment idea, interview or financial product review? Become a Junior Stock Review VIP now – it’s FREE!


Adventus Zinc Corp. – ADZN:TSXV

MCAP – $34.2 million CAD (at the time of publishing this report)

Adventus Zinc is a young company, having just completed its IPO in February of this year. Interestingly, it also has a great list of strategic shareholders, which includes Altius Resources Inc., Resource Capital Funds, Greenstone Resources, John Tognetti and Equinox Funds. Adventus has 10 projects in both Newfoundland & Labrador and Ireland, two premier mining jurisdictions; ones which I believe are only going to get more attention from the mining industry in the years to come. Check out the interview to get a good overview of the company.

Disclaimer: The following is not an investment recommendation, it is an investment idea. I am not a certified investment professional, nor do I know you and your individual investment needs. Please perform your own due diligence to decide whether this is a company(s) and sector that is best suited for your personal investment criteria. Junior Stock Review does not guarantee the accuracy of any of the analytics mentioned in this podcast. I do own Adventus Zinc Corp. shares. I have NOT been compensated to do this podcast.


Posted on

The Nickel Market: Investing Ahead of the Crowd – Part 2

Nickel Consumption By Use

In Part 1 of this report, we discussed the nickel supply fundamentals and identified important factors that can help to indicate where nickel supply is headed. To refresh your memory, here are a couple of the most important factors:

  • The partial Indonesian ban on nickel exports should continue as the country looks to develop its smelting industry.
  • The Philippines have suspended or closed roughly 50% of its annual nickel production due to environmental concerns. In 2016, the Philippines were the world’s largest nickel producer, given the current direction of government policy, and the fact that their nickel output is down 24% year-over-year in 2017, this will not be the case in 2017.
  • Analysts from Scotia and RBC Capital Markets expect nickel supply to grow at 2% per annum until 2020.
  • Total global nickel inventories are trending downwards, falling 15% to below 500,000 tonnes, since hitting a high in April of 2016.

Nickel Supply Versus Demand

Source: RBC Capital Markets

Let’s take a look at nickel demand, by first examining the refined production, which includes LME-grade nickel and host of intermediate nickel products such as NPI, nickel concentrate, ferronickel, nickel sulphate and more.


The Refined Nickel Supply

Nickel Refined Supply

Source: RBC Capital Markets


The global refined nickel supply for 2016 was around 1.9 million tonnes, which was 48,000 tonnes below the global demand. Of the 1.9 million tonnes of refined nickel, 44% is produced by former Eastern Bloc countries.  Given their less stringent environmental laws and overall lower cost structure, the former Eastern Bloc countries dominate the nickel ore refinement industry.

The global refined nickel capacity is estimated to be around 3.2 million tons. Putting it into perspective, current mine production is sitting at around 2.25 million tons, which is roughly 30% of the global refined capacity. However, note that the bulk of the capacity is in China and their figures, in my opinion, should not be taken as 100% valid.

The future of the global refined nickel industry will be shaped by a few key developments over the coming years.


Indonesian Ban and its Effect on Refinement

As discussed in Part 1, the global landscape for refinement changed in 2014 when the Indonesian government banned the export of its nickel ore in favour of promoting investment in refinement facilities within its borders.

Indonesia’s nickel refinement capacity has spiked dramatically since 2013, moving from around 10,000 tons in 2013 to over 100,000 tons in 2016. This new capacity mainly replaces capacity in China, as China’s refined nickel production has fallen by around 7% since the export ban.


The Environment vs. Metal Refinement

Currently, China has suspended the use of heavily polluting smelting operations in both the nickel and zinc industry. This is proof that air quality is becoming a leading political issue, even in states which typically buck the current political trends of the rest of the world. Time will tell how this will play out in the nickel market, especially in the face of what looks to be growing demand.

Interestingly, much of the nickel demand in the future is projected to come from electric vehicles (EV). The irony of the EV movement, in terms of it being non-carbon emitting, is the fact that the vast majority of the materials which make up the EV are all mined and refined, which is exactly what some countries are trying to curtail. I suppose you can’t have your cake and eat it, too.


Nickel Production Cost Curves

A cost curve is a graphical analysis which plots production capacity versus the costs of the entire industry. The cost curve is an important piece in the analysis of commodities as it allows the curious investor to see how the current spot price of the chosen metal fits in with the current cost of production across the sector.

Companies that find their cost of production in the lowest quartiles of the cost curve are those least likely to be affected by low spot prices. The nickel market has been plagued with low spot prices for a number of years, due to excess supply, but as we saw last year, this is changing.

RBC Capital Market’s cost curve for the nickel industry reveals that the 75th percentile of the industry’s cash cost is $5.05 USD/lbs, meaning that 25% of the world’s nickel producers will have negative cash flows as a result of $5.05 USD/lbs spot price.

Generally, for a healthy market, analysts look to the 90th percentile of the cost curve to suggest an sustainable price. In terms of the nickel market, the 90th percentile represents a cost of production of $7.85 USD/lbs.

Compared to today’s nickel spot price of around $5.17 USD/lbs, that is a 50% increase to reach a level in which 90% of producers will be able to produce nickel at a profit.


A Conversation with Martin Turenne

As in Part 1, I had the chance to ask FPX Nickel Corp. CEO, Martin Turenne, a series of questions pertaining to the global nickel market. Highlights from our interview will be shared throughout the report.

FPX Nickel Corp.

FPX Nickel Corp. (FPX:TSXV)

MCAP – $16.1 million CAD (at the time of writing)

CEO – Martin Turenne


Question #1

Brian: In every industry, the success of a company or sector is based around the delta between the cost of production and the selling price, or more simply, the amount of profit. Given that the current nickel price is roughly $5.17 USD/lbs, roughly 25% of the nickel industry’s producers are not making money.

In your opinion, what are the 3 biggest factors affecting the nickel spot price, and will their resolution lead the nickel spot price up to what many analysts believe is the key long-term price for nickel producers, roughly $7.85 USD/lbs?

Martin: The overall theme driving the price higher is the fact that nickel demand is exceeding supply, and will continue to do so well into the 2020s. The first reason for that is strong demand growth. In 2016, nickel demand was 6% higher than the previous year, which was by far the highest demand growth among the major base metals. I expect to see continued demand growth in that range for the next several years.

The second reason has to do with nickel supply growth, which is going to be relatively weak. Because nickel has been so badly beat up, and because there has been so little investment in nickel exploration and development, there just aren’t many new projects which can be brought into production in the next five to eight years. I’d argue this is a more acute issue for nickel than it is for metals like zinc and copper, which have attracted far more capital in recent years.

Finally, I think you will see operating costs increase in the coming years. In the past several years, operating costs in the mining industry have been declining mostly due to a strong U.S. dollar and lower energy costs. Going forward, a decrease in the U.S. dollar or increase in oil prices will lift the nickel cost curve, and thus lift the nickel price.

Nickel Demand

So far, we’ve covered the global nickel mine supply/production figures and also taken a look at global nickel refining numbers and the factors affecting their markets. The last piece of the puzzle is nickel demand, the how and why it’s used in society and where I believe it’s headed.

It isn’t a stretch to say that nickel is one of the most important industrial metals in the world. It’s used in construction, power generation/storage, food preparation, cell phones and vehicles. Nickel has a unique blend of properties such as corrosion resistance, high strength, and toughness.


World Nickel Consumption

Nickel Consumption By Use

Source: RBC Capital Markets


Question #2

Brian: 2/3 of refined nickel is consumed by stainless steel, the remainder is broken down into much smaller demand sources. This demand pattern has existed for refined nickel consumption for a while now.

How do you view the future of refined nickel demand? Will stainless steel still be the dominant consumer or are there other sources of consumption which may begin to play a bigger role? Please explain.


Martin: Among all the major base metals, nickel had the best growth profile in 2016, with demand rising 6% compared to 2015 demand. Going forward, analysts are predicting annual demand growth in the 2-3% range, which in my view is too conservative. Stainless demand will continue to play a dominant role in nickel, but the growth associated with electric vehicle (“EV”) batteries will be the big story over the next decade. Right now, EV battery nickel demand is approximately 70,000 tonnes per year, or only about 3% of total nickel demand. Going forward, Roskill predicts that number could reach 400,000 tonnes per year by 2025, which implies an average demand growth rate of 2% per year for nickel from EV battery demand alone. From today’s levels, I can see nickel demand growing 5% per year for the next several years, which would likely push the nickel price well above the current consensus number.


Stainless Steel

As you can see, 2/3 of refined nickel is used in the production of stainless steel, while a further 15% is used in the manufacturing of other ferrous and non-ferrous alloys.  Stainless steel is an alloy of traditional steel and the combination of nickel and chromium, typically with 8 to 12 percent nickel content.

Stainless steel’s uses are numerous, ranging from cookware to appliances, building materials and high-tech applications. The stainless or corrosion resistant properties are homogenous or consistent across the entire section of steel, giving it a huge advantage against the other corrosion resistant materials which are mainly coatings.

From a food preparation or eating perspective, there currently isn’t any other material that can withstand the temperature ranges, pHs, bacteria exposure or repeated usage like stainless steel.  Utensils, cookware, appliances and food prep surfaces all use stainless steel as the preferred material of choice.


The Use of Stainless Steel in Marine Infrastructure Construction

Stainless steel may get a huge boost in the near future as a few of the southern States (US) look to increase the grade of rebar used within all of their marine construction. For those who don’t know, my background is in steel manufacturing. I was General Foreman of operations at a rolling mill which produced rebar, angles, channels and flats.

Typically, concrete / rebar construction is designed with a 25 to 50 year life span, however, marine construction, in particular, has come under scrutiny for not being robust enough, which has prompted some States to look at increasing the construction specifications for the materials used in marine construction. For rebar, this means higher grade requirements and possibly being restricted to only corrosion resistant steel.

Currently, epoxy coated rebar is used for applications that require corrosion resistance, however, epoxy coatings have been known to crack, allowing for moisture to begin its oxidation of the steel.

Also, galvanized steel is an option for this application, as it, too, provides a corrosion resistant coating to the rebar. However, like the epoxy coating, it’s susceptible to wear and damage and a worn or damaged zinc layer leaves the under body of the steel product  vulnerable to moisture.

Without a doubt, construction is moving toward more stringent regulations for the structures being built in our cities. I believe one of the big winners of this movement will be the strong corrosion resistant materials, which are headlined by stainless steel.


Electric Vehicles

Arguably the largest catalyst for a major increase in nickel demand is the rise of electric vehicles or, more specifically, the use of batteries in our vehicles. As we discussed in the factors affecting the mining and smelting of nickel, the environment is a major political issue, one that is currently centred around clean air.

Governments around the world are pushing us toward a goal of reducing the amount of carbon we emit into the atmosphere. One of the first industries to feel this disruptive wave is the automotive sector, which has seen government subsidies for electric vehicles (EV) propel companies such as Tesla into the forefront of both the automotive industry and popular culture.

The culmination of these events has sent all of the other major automotive companies spinning as they try and catch up to a growing segment of the market.


Batteries

While nickel is used in a variety of ways in vehicles, by far its biggest use is within an EV, where it’s used in the batteries.  Currently, the misnomer is that a lithium ion battery is primarily made up of lithium, but the fact is, it isn’t. Lithium ion batteries contain more nickel, cobalt and manganese than they do lithium.

Nickel’s current use within the EV market is very small, especially when compared to global nickel demand. However, it’s the potential that we must gauge when it comes to nickel demand in batteries, not the EV market’s current consumption.


Lithium Ion Batteries

Depending on the application, currently, what makes up the cathodes for the most common lithium Ion battery is nickel, manganese and cobalt (NMC), or nickel, cobalt and aluminium (NCA) and an anode typically composed of graphite. To note, the cathode does contain other materials such as lithium, but in smaller quantities than the big 3.

For those unfamiliar with how batteries work, here’s a quick summary; there are three basic components to most batteries: cathode, anode and electrolyte. A chemical reaction causes a charge difference between the anode and cathode. This charge difference allows the electrons (electrical current) to flow between the anode and cathode and, in the process, the electrical current powers the piece of equipment to which the battery is attached.

A number of sources, including the Battery University, confirm that the NMC battery is the battery of choice when it comes to power tools and other electrical power trains. The cathode chemical composition is chosen on 4 key criteria: stability of materials, energy density, specific energy and cost.

Today, NMC batteries are typically found with compositions of equal parts, denoted 1-1-1, but have started to be made in ratios as high as 8-1-1. Due to higher cobalt prices and security of supply, the percentage of nickel is beginning to move higher.

Interestingly, depending on the applications, cobalt can be reduced and still maintain acceptable performance, as the higher percentage nickel batteries have higher energy densities and longer life spans, although, they produce a lower voltage.

Lastly, it should be noted that roughly only 50% of the current nickel mine supply is suitable for battery use, as the low-grade nickel products are inadequate for battery manufacturing. Given that nickel mine supply growth is mainly in NPI and FeNi, which are low grade products, it would appear that available supply for the emerging battery market is fixed at its current production rate. Considering this fact, it is apparent that a growing battery sector will certainly have an effect on the nickel market.


Projected Nickel Demand Via EV Batteries

Worldwide, Statista says that since 2014, on average, there have been 73.7 million cars sold each year. According to Inside EVs, in 2016, 777,497 EVs were sold worldwide. Considering that just 5 years previous only 17,425 EVs were sold, this gives us a Compound Annual Growth Rate (CAGR) of 88.33%.

Therefore, using the EV CAGR and projecting out until 2021, you get a demand of 18.4 million electric vehicles.

Now that we have determined the possible future demand for EVs, it is possible to calculate the amount of nickel which these EVS will require. To do this, I will use a figure published by Glencore on their twitter account, which states that,

“Every new #electricvehicle – from its motor & batteries, to the charging point will need c.160kg of copper, 11kg of cobalt & 11kg of nickel.” ~ Twitter – Sept. 7, 2017

Clearly Glencore is using a NMC battery configuration of 1-1-1, which I believe should give us a conservative estimate of future nickel demand.


Therefore, if 18.4 million EVs are sold in 2021, the amount of nickel demand is calculated by:

18.4 million EVs x 11 kg Ni/EV = 202,400,000 kg of Ni

202.4 million kg of Ni x 1/1016.05 kg = 199,203.4 tonnes of Ni

199,203.4 tonnes of Ni / 1,957,000 tonnes of Ni (2016 mine production) = 10% of 2016 mine production


This is just a rough calculation with a couple assumptions, however, it does give us perspective on how powerful and disruptive this clean air policy trend can be.  If the nickel market was hit with 199K tonnes of high grade nickel demand in the next few years, it would put tremendous pressure on the market, and in my opinion would result in higher nickel prices.

Dramatic price spikes in the nickel spot price will cause battery manufacturers to look for alternatives to nickel. This won’t happen overnight, but it’s pertinent to expect battery improvements along the way that may reduce or eliminate the amount of nickel used within the battery composition, just as manufacturers are reducing the cobalt portion of the batteries to compensate for higher cobalt prices.


Concluding Remarks


Question #3

Brian: Putting it altogether, there are a few key aspects of the nickel market which need to be watched in order to gauge where the nickel market is headed in the near term. That said, still contend that the future is bright for nickel.

Can you give us one final concluding comment on the nickel market, how you believe the narrative plays out and, ultimately, where the nickel market is headed in the next 12 months?


Martin: The spot price has made a huge move since mid-June, going up 35%, but since the base metals marked their bottom in January 2016, nickel is still lagging the price moves made by copper and zinc. Going forward, I expect to see nickel continue to play catch-up with those metals, largely because demand continues to exceed supply by a large margin. If we assume continued, steady mine production from Indonesia and the Philippines, the nickel market will continue to be in deficit and the spot price should be supported. But, if we see any further actions to restrict production in those countries, there’s potential for another explosive move upward. In either case, FPX Nickel is very well-positioned to capitalize on an increasing spot price with the ongoing advancement of our Decar project in British Columbia, which we believe is the finest development-stage nickel asset in the world.


It’s my contention that nickel will continue to play a major role in our everyday lives, as its uses continue to grow. Let me summarize my thoughts in a few key points:

  • Watch the actions of the Philippine government closely, as their choice to ban nickel ore exports and/or suspend/close mining operations within its borders will have major implications on the nickel ore supply.
  • Government environmental policy, particularly that associated with air pollution, will affect the nickel market in two ways: First, it will constrain supply as both the Philippines and China suspend/close operations. Second , it will create demand for nickel via the emerging EV automotive sector.
  • Infrastructure building regulations will only get more stringent as government looks to extend the life spans of their structures past 50 years. Corrosion resistant steels will play major roles in this trend, with stainless steel leading the pack.
  • Current nickel spot prices leave 25% of the nickel producers in negative cash flow. If this trend continues, producers will go out of business and supply will fall further. A rise in the nickel price isn’t necessarily imminent, but it’s inevitable.
  • Global nickel inventories are falling, but are still high relative to current production. Watch for continued drops in inventory levels, as it is my guess that the Philippine government will move forward with their decision to ban nickel ore exports.
  • High-grade nickel demand is set to grow in the future, as the EV market continues to grow worldwide.

While there are a few key aspects to watch, I still contend that the future is bright for nickel and will be looking for opportunities to invest ahead of the crowd.


Until next time,


Brian Leni  P.Eng

Founder – Junior Stock Review


Disclaimer: The following is not an investment recommendation, it is an investment idea. I am not a certified investment professional, nor do I know you and your individual investment needs. Please perform your own due diligence to decide whether this is a company(s) and sector that is best suited for your personal investment criteria. Junior Stock Review does not guarantee the accuracy of any of the analytics used in this report. I do own FPX Nickel Corp. shares. I have NOT been compensated to write this article.


Posted on

Anaconda Mining – An Undervalued Gold Producer on Canada’s East Coast

Anaconda Mining

With turmoil ramping up around the world in recent weeks, from Hurricane Harvey wreaking havoc in Texas to the mounting discord between North Korea and the United States over missile testing, and a weakening U.S. dollar, the price of gold pushed up over $1300/oz USD.

A rising gold price and the end of the summer doldrums could spell the beginning of the next leg up in the gold bull market. For those looking to profit in this next wave, today I have a gold producing company which is set to be re-rated in the coming months.

This company is Anaconda Mining, a gold producer with its flagship property, The Point Rousse Project, on the Baie Verte Peninsula in Newfoundland & Labrador. Looking out to 2020, the company’s short term goal is to significantly increase their gold production up to 50,000 ounces per year. Through further project acquisitions in Atlantic Canada which have NI 43-101 resources, and the development of Anaconda’s existing projects, they hope to leverage their team’s mine building experience and existing Point Rousse Project infrastructure, Pine Cove Mill, port and in-pit tailings facility, to push them towards their long term goal of becoming a 100,000 ounce per year producer.

Here is an executive summary of my conclusions on Anaconda, which will be followed by my in-depth analysis of the company.

  • Led by CEO, Dustin Angelo, Anaconda has a great team of professionals who are looking to take the company to the next level.  The Goldboro Project acquisition and further acquisitions in the future will cement Anaconda’s reputation as a premier gold producing company.
  • Anaconda Mining’s assets are located in Canada, more specifically, the provinces of Newfoundland & Labrador and Nova Scotia. These are premier destinations for mining as they present a stable political landscape and world-class geology.
  • Anaconda achieved gold sales totalling 15,562 ounces in the fiscal year ended on May 31, 2017. The gold was produced from the cash flowing Point Rousse Project, which includes the Pine Cove Mill and Mine.
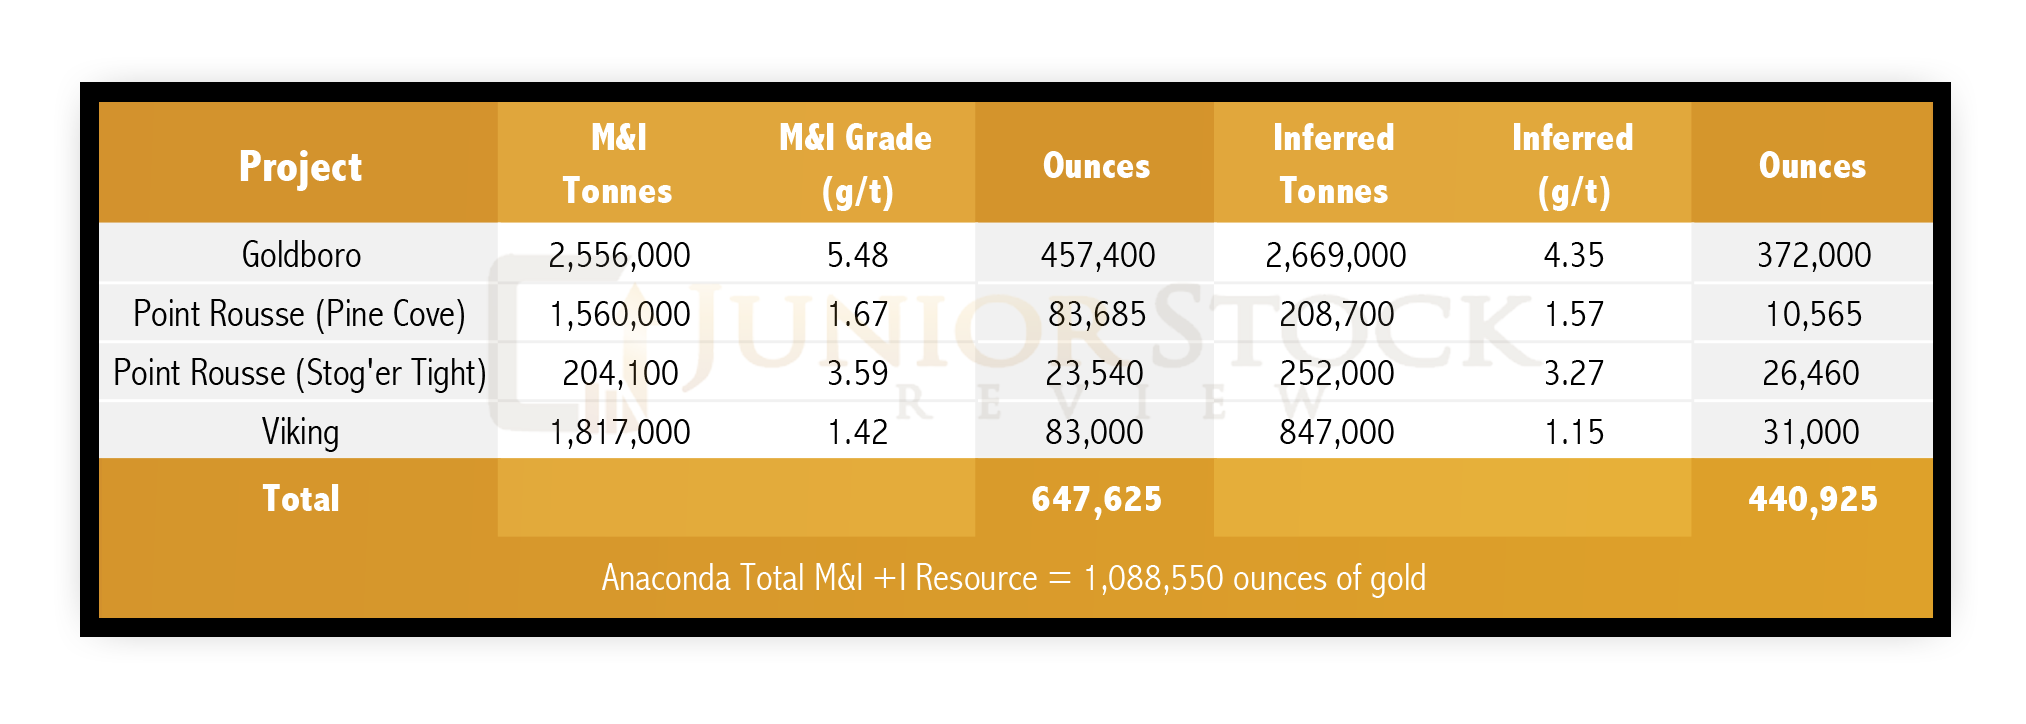
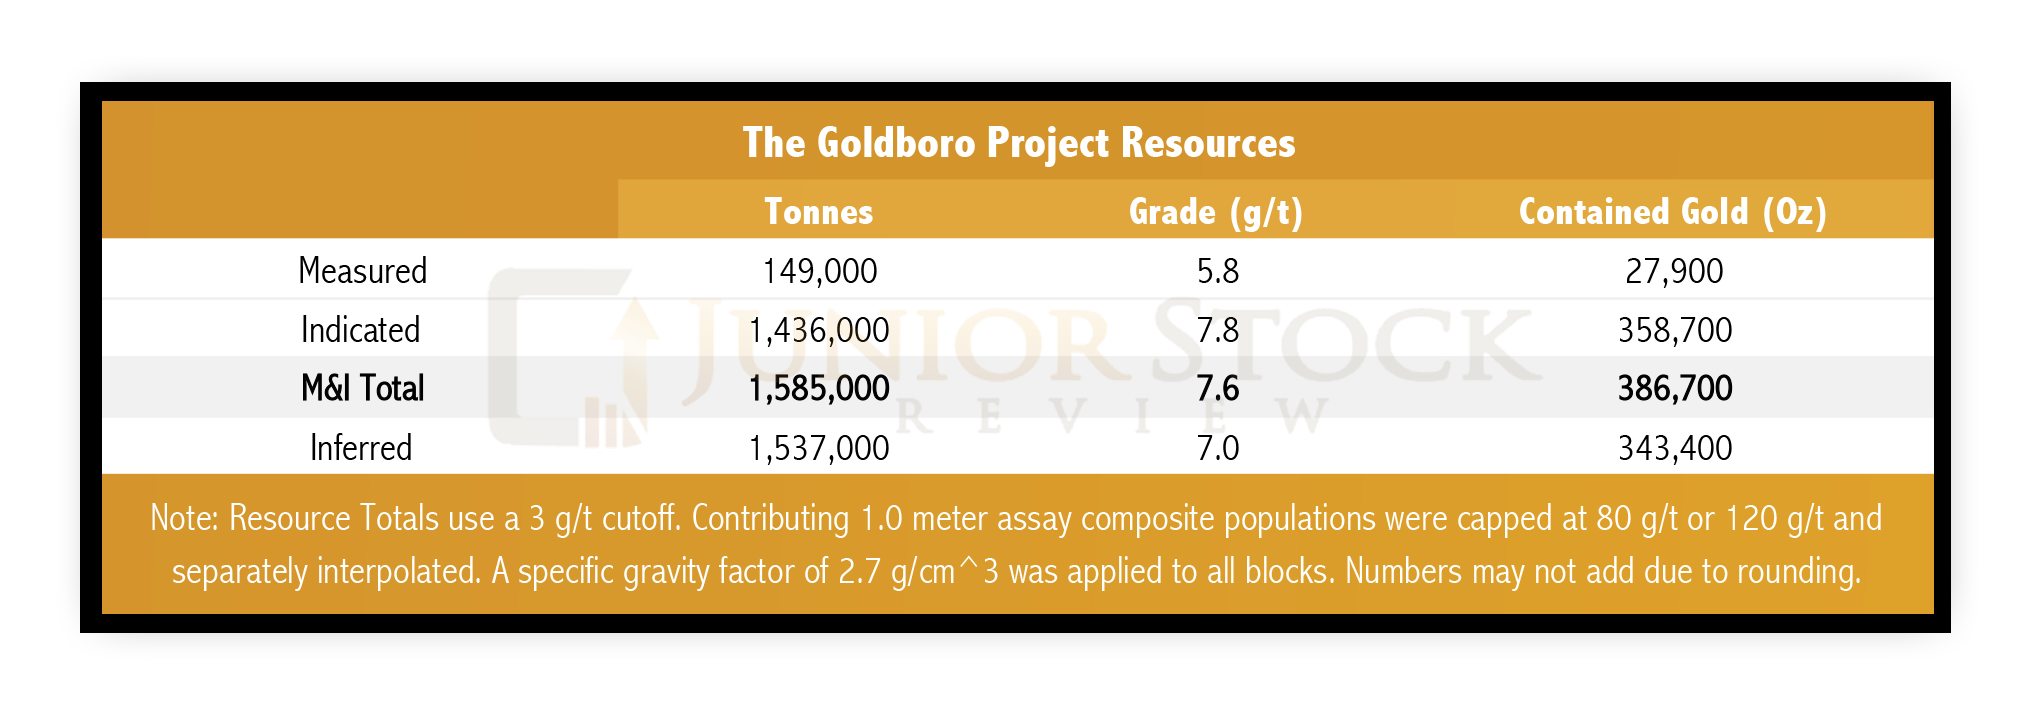
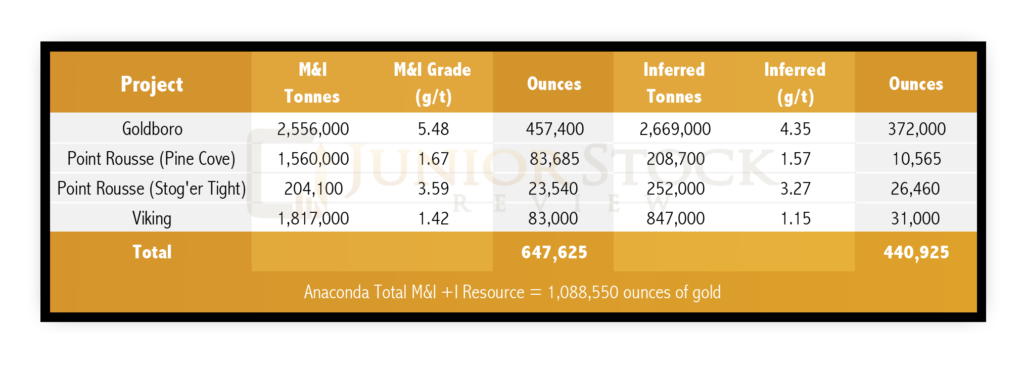
  • Existing 43-101 Measured & Indicated + Inferred Resource Total of 1.1million ounces of gold
  • Anaconda Mining’s EV/Oz is well below similar gold companies developing properties on Canada’s east coast.
  • PUSH: Anaconda will be drilling Goldboro this fall, with the intent of both expanding the resource and shoring up the existing deposit. Watch for these drill results.
  • PUSH: A PEA on the Goldboro Project will be completed by the end of this year, giving us a clear picture on the project’s potential profitability.


Anaconda Mining (ANX:TSX)

MCAP – roughly $28.6 million CAD (at the time of writing)

Cash – As reported in Anaconda’s news release dated August 2017, reflecting fiscal year end on May 31, 2017 – $2.5 million CAD

Shares – 382.0 million – NOTE: On May 8, 2017 Shareholders voted to give management the right to consolidate shares – 0.25 to 1. The Board of Directors has discretion to implement a consolidation within 12 months.

Stock Options – 33.0 million

Warrants – 34.0 million

Fully Diluted – 449.0 million

Officers & Directors’ Ownership – 7.8%


Anaconda’s People

Since taking the helm of Anaconda Mining in 2010, CEO, Dustin Angelo, has eliminated the company’s interest bearing debt and funnelled cash flow towards the development of its Point Rousse Project and further expansion of their land package, increasing it ten-fold over the last 6 years.  The Goldboro Project, Anaconda’s most recent acquisition under Angelo, is the most aggressive to date, adding much needed gold resource ounces to Anaconda’s books.

Previously, Angelo held senior level management positions with Waller Capital Corporation, MHI Energy Partners and Elgin Mining Incorporated. These positions have given him a great base of knowledge and experience to draw on, as he leads Anaconda Mining into a major stage of growth, during what looks to be one of the biggest gold bull markets in history.

Also to note, Angelo is an accountant by trade, earning a BSBA in accounting and international business from Georgetown University and a MBA from the Columbia Business School.

Speaking from experience and a little bit bias, operations are the heart of any mining or manufacturing company.  Let’s take a look at who is leading operations for Anaconda.

At the top of operations is COO, Gordana Slepcev. Slepcev, prior to her promotion, was VP of Technical Services, managing the mining and geology departments at the Point Rousse Project. Now in her new position, she is responsible for all operational aspects of the company, including permitting, mine development,  strategic planning, project evaluation, and also delivering long/short-term planning and geological support to mining operations. Slepcev is a professional mining engineer and has prior working experience with Labrador Iron Mines Holdings, Agrium Inc., and Western Coal Corporation.

Next is Anthony Chislett, Operations Manager for the Point Rousse Project, managing all aspects of the milling and mining operations. The Pin Cove Mill will be counted on in the future to process ore from Anaconda’s other projects and still maintain a high level of efficiency in its recoveries. Chislett and those who operate the mill will be strong contributors in the near future as they get set to incorporate Goldboro’s ore. Chislett has a Certificate in Civil Engineering Technology and over 26 years of work experience over his career.

Additionally, Robert Dufour is the CFO, Allan Cramm is VP of Innovation & Development, Paul McNeill is VP of Exploration, and Lynn Hammond is VP of Public Relations.


Anaconda’s Board of Directors

Anaconda’s Board of Directors has a great balance of experience, with members who have strong resumes in both the geological and financial sides of the mining industry. Here is a quick look at the board members:

John Fitzgerald is the Chairman of the Anaconda Mining Board of Directors and former Chairman and CEO of Orex Explorations. Fitzgerald’s expertise in finance comes from 25 years in the investment banking industry. Also, he has been a member of or advised a number of different companies including Boston Poly Corporation, Epcylon Technologies, DayStar Technologies, Hesat Acquisition Corp., iSense Corporation and Trustwater PLC.

Michael Byron is a board member and also the CEO of Nighthawk Gold, a gold exploration company, exploring the Indin Lake Greenstone Belt in the Northwest Territories. Byron, a geoscientist, has been in the mining industry for over 30 years and brings  with him plenty of geological technical expertise to the Anaconda Board.

Additionally, on the geological technical side, is Kevin Bullock, a registered Professional Mining Engineer with over 25 years of experience in the mining industry. Currently, Bullock is the CEO of Golden Reign Resources and has held senior positions at a number of other junior mining companies, including being a Director at B2Gold.

On the financial side of the Board are Maruf Raza,  Jacques Levesque, and last but not least, Anaconda’s CEO, Dustin Angelo.


Newfoundland & Labrador and Nova Scotia

The bulk of Anaconda Mining’s assets, Point Rousse Project, Viking Project, Great Northern Project and Tilt Cove Property, are located on the island of Newfoundland in the province of Newfoundland & Labrador.  The Goldboro Project, their most recent acquisition from Orex Exploration, is located in Nova Scotia.

Both Newfoundland & Labrador and Nova Scotia are provinces located on Canada’s east coast. Both provinces have a long history of mining but have recently seen a staking rush, particularly on the island of Newfoundland.


Newfoundland & Labrador

I recently wrote an article about Newfoundland & Labrador and why I think it is a premier destination for our mining investment dollars; for the full article follow this link. Otherwise, here is a list of my summarized thoughts regarding Newfoundland & Labrador:

  • Newfoundland & Labrador’s geology has long been associated with base metals such as iron ore and nickel, however, I think this is quickly changing as a number of precious metals companies look to explore and develop some highly prospective properties. Compared to the rest of Canada, NL is under explored, especially for precious metals, such as gold.
  • Newfoundland & Labrador encourages mineral exploration within its borders with the Junior Exploration Assistance Program (JEA). While the available funds in the program are small, it is a step in the right direction towards encouraging mining investment in Newfoundland & Labrador.
  • Newfoundland & Labrador has a workforce which is accustomed to heavy industry. With low oil prices hurting the oil fields of Alberta, many native Newfoundlanders are finding their way back to the island and, with them, comes multiple years of heavy industrial experience. As properties develop, there is both a workforce to fill the needed positions and the infrastructure to produce and export their goods.
  • The people of Newfoundland & Labrador have consistently voted for Conservative and Liberal governments since joining Canada in 1949. I expect this tradition to continue, which presents a stable political landscape for mining companies looking to explore and develop properties within its borders.
  • From an investment standpoint, First Nations’ involvement in the mining sector can cause trepidation for the investor. In Newfoundland’s case, this isn’t an issue, as the First Nations do not control any large blocks of land that are prospective for mineralization. NOTE, it is a different story for Labrador.


Nova Scotia

  • Since 2013, Nova Scotia has been led by Premier Stephen McNeil, a member of the Canadian Liberal Party. Historically, dating back to Confederation, the people of Nova Scotia have voted either Conservative or Liberal, however, it should be noted that they did vote NDP in 2009, by electing Darrell Dexter who is a member of the NDP Party. For those unaware, the NDP Party is typically cast as being bad for business, and given their history, this isn’t without cause. However, even though the past is typically prologue, we need to examine the policies of each incoming government no matter what their party affiliation, as they are all capable of introducing policy which is detrimental to mining. One thing to keep in mind, Nova Scotia’s unemployment rate is almost 9%, a government which would hinder job creation in the province’s current state wouldn’t last long.
  • In total, there are 16,245 registered Indians in Nova Scotia. The Indian population is represented by 13 band councils and 2 tribal councils, the Confederacy of Mainland Mi’kmaq and the Union of Nova Scotia Indians. The Mi’kmaq are the predominant Aboriginal group in Nova Scotia, with 13 communities across the province.
  • Nova Scotia has a long history of mining dating back 300 years. Gold, in particular, has played a big role in the Nova Scotia economy, with 3 separate gold rushes having produced over 1 million ounces gold since the 1860s.
  • Geologically, Nova Scotia is broken up into two main geological terranes. The Avalone Zone, which forms the northern half of the province, and the Meguma Zone which forms the southern half. The two zones are separated by the Cobequid-Chedabucto Fault Zone, which runs east to west. This fault zone represents where the two zones collided over 400 million years ago. The geology specific to Anaconda’s Goldboro can be found later on in this article.


Anaconda’s Properties

Anaconda Mining Total Resources

Source: Anaconda Mining Corporate Presentation – August 2017

The Point Rousse Project

The Point Rousse Project is Anaconda’s Flagship 6,300 hectare property and is located on the Baie Verte Peninsula which is on the north west coast of the island of Newfoundland in the province of Newfoundland & Labrador.

Aerial Map of Pine Cove Mill and Mine

Source: Anaconda Mining – Appendix Slide 1


The Point Rousse Project consists of the Pine Cove Mill and Mine, the Argyle Zone, the Stog’er Tight Deposit and Aggregates Project, all are located within 8 km of each other. The Project is underlain by Cambro-Ordocivian ophiolitic and cover-sequence rocks of the Point Rousse Complex, which is part of the Baie Verte Tract.

The Point Rousse Complex is host to both orogenic-style gold and volcanogenic sulphide mineralization. There are three identified mineralized trends within the Project: the Scrape Trend, the Goldenville Trend, and the Deer Cove Trend.


Pine Cove Mill and Mine

The Pine Cove Mill and Mine began producing in 2008, with commercial production achieved in September 2010.  To date, Pine Cove has produced 76,379.34 ounces of gold. In a news release dated August 25, 2017 Anaconda announced it fiscal year ending production figures which were highlighted by:

  • Pine Cove Mill increased throughput by 8% to 1,223 tonnes per day when compared to the 2016 fiscal year.
  • Operating cash cost per ounce sold was $1,126 CAD or USD $$856/oz and an all-in sustaining cost (AISC) per ounce of $1,735 CAD.  NOTE: Remember that AISC includes: CAPEX, Corp Admin and exploration expenses.
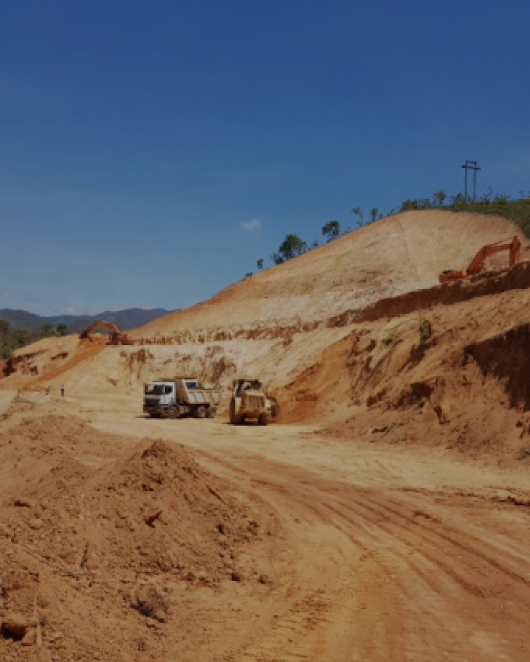
  • Additionally, the Pine Cove pit, generated $0.9 million CAD from the sale of waste rock.  Anaconda is working with Shore Line Aggregates and Phoenix Bulk Carriers to supply 3.5 million tonnes of construction aggregate using Anaconda’s waste rock from the Pine Cove Mine and Mill operation. The waste rock is transported via Anaconda’s Point Rousse Port Facility.

The Pine Cove Mine is an open pit design, which is designed to be 350 m wide by a maximum depth of 150 m by the end of mine life. The pit’s main access ramps are designed at a 10% gradient and are 15 m wide, facilitating two-way truck traffic. The pit rock is drilled and blasted and then loaded into haul trucks by excavators, which transport the ore to the crusher ROM Pad.

The future of Anaconda lays in the hands of the Pine Cove Mill, which operates as a grind/flotation circuit followed by leaching. The Mill will be counted on in future to process the ore generated by Goldboro and Anaconda’s other deposit on the island of Newfoundland.

Here is an excerpt from the 2015 Point Rousse Technical Report,

“The concentrator has a flotation circuit which produces a gold-pyrite concentrate that advances to the leach circuit. Comminution is via a two-stage crushing plant followed by a 10 ft by 14 ft primary ball mill. Cyclone overflow feeds the flotation circuit, with four unit cells for roughing and one cleaner cell. Mass recovery is typically 2-4 percent. Flotation concentrate is thickened in a 4.5 m diameter thickener and reground in a 5.5 ft diameter ball mill. Leaching is conducted in a series of four 70 cubic metre mechanically agitated leach tanks. Two drum filters and a Merrill-Crowe circuit are used for gold recovery from the pregnant solution. Cyanide destruction of leach tailings is achieved through the Inco SO2 process. The mill currently achieves 86-88 percent recovery.” ~ 2015 Point Rousse Technical Report – pg. 21

Anaconda has two tailings facilities and a polishing pond. The Tailings 1 storage facility had its final expansion in 2014, increasing its elevation up to 103 (msl). Additionally, in the last fiscal year, the Tailings 2 storage facility and new polishing pond were constructed on the property.


Stog’er Tight Deposit

The Stog’er Tight Deposit was originally discovered by Noranda Exploration Company in the late 1980s. Anaconda optioned the property from 1512513 Alberta Ltd. in 2012, with the intent of securing future supply for the Pine Cove Mill.

Anaconda has since worked on evaluating the deposit’s potential, by the verifying of historic drill data with the completion of nine twinned diamond-drill holes. Anaconda’s work indicates that other similar prospects lay adjacent to the Stog’er Tight Deposit and may represent an expansion of resource for the area.

Currently, the Stog’er Tight Deposit is estimated to contain Indicated Mineral Resources of 204,100 tonnes grading 3.59 g/t gold for a total of 23,540 ounces and an Inferred Resource of 252,100 tonnes gtrading 3.27 g/t gold for a total of 26,460 ounces, both using a cut-off grade of 0.8 g/t gold.

As mentioned in the August 25, 2017 news release, CEO, Dustin Angelo, states,

“Looking ahead to 2018, the Company is projecting to produce and sell approximately 15,500 ounces of gold.  Production in the first three quarters will be from the Pine Cove Pit, and will transition to the Stog’er Tight pit early in the 2018 calendar year.”


Argyle Zone

The Argyle Zone is a highly prospective zone located immediately northwest of the community of Ming’s Bight.  The Argyle Zone has seen a reconnaissance soil survey in 2012, with a total of 364 samples collected at 25m intervals. These samples returned some impressive assay values, highlighted by 112 samples assayed 25 ppb gold or greater to a maximum of 4.88 g/t and several pieces of mineralized float returned assay values of up to 9 g/t gold.

The property has since seen additional exploration work including an airborne magnetic survey, trenching and drilling. The trenching revealed strongly-altered, quartz-veined and pyritized gabbro. Highlights of the trenching include 3.75 g/t gold over 16 m and 1.49 g/t gold over 3.5 m. While a total of 5,000m of drilling has been completed on the zone, which is highlighted by 3.63 g/t gold over 12m, 5.52 g/t gold over 12m, and 9.31 g/t gold over 6m.

Argyle remains a highly prospective Zone within a stone’s throw of the Pine Cove Mill; it will need additional exploration to fully understand its potential.


The Goldboro Project

Anaconda’s Goldboro Project is located on the north east coast of Nova Scotia and consists of 37 mineral claims on 600 hectares. The main portion of the Goldboro property is accessible year- round via Highway 316 on a 2.5 km gravel road, with the other more obscure parts of the property having access via logging roads.

Highway 316 connects Goldboro to the nearest full service town of Antigonish, which sits approximately 75km to the north west. The capital of Nova Scotia and home to the province’s international airport, is Halifax, which sits 250 km to the south west.

Arguably the most important available access to the property comes from Isaac’s Harbour, a tide water port which is key for Anaconda’s plan to transport Goldboro’s ore back to their existing Pine Cove Mill in Baie Verte, Newfoundland & Labrador. Also, to note, a larger deep water port is located 60 km north east, in the Strait of Canso Superport.


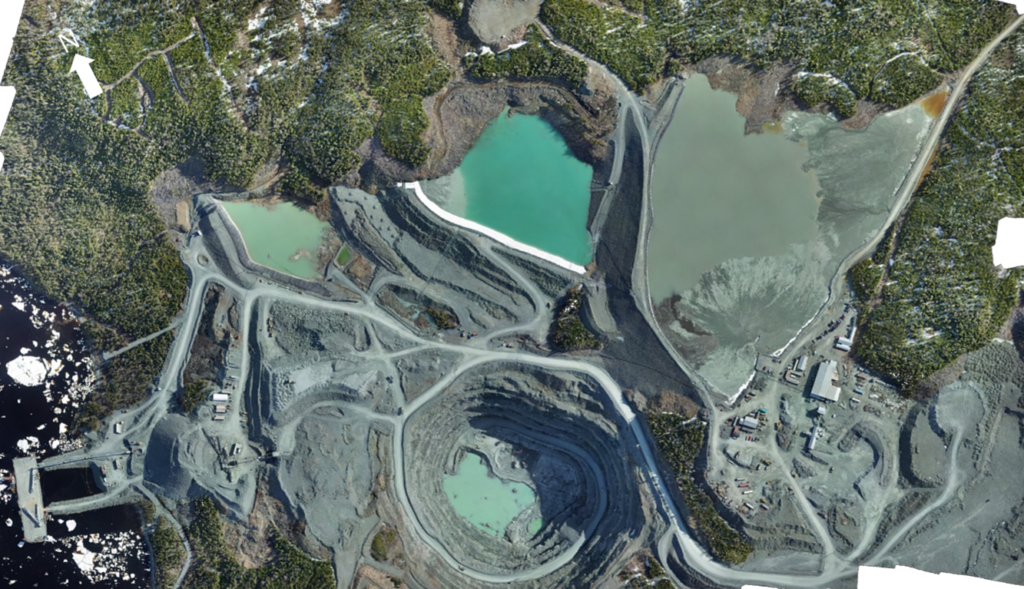
Goldboro Infrastructure

The property has access to power and has existing buildings, a tailings pond, a settling pond and some advantageous underground workings.

Goldboro’s existing underground infrastructure includes a vertical shaft from surface down to the old 400 ft level and an inclined shaft from the bottom of the vertical shaft, running down plunge of the anticline fold axis of the main Boston-Richardson Belt down to the old 700 ft level. Also, there are several drifts which could possibly be used for future exploration, along with some minor workings in the East and West Goldbrook zones.


Goldboro’s History

The Goldboro property has a long history, dating back to 1862 when mineralization was first found, and then 1893 when mining began. In the 17 years that it was mined, it produced roughly 55,000 ounces of gold at an average grade of 4.5 g/t.

Modern exploration began on the property  with Patino Mines Ltd in 1981. Further work was completed on the overlying claims by Onitap, who completed diamond drilling, airborne VLF-EM and magnetic surveys and ground based IP surveys.

In 1988, Orex Exploration purchased the property from Onitap. Over the course of the next 26 years, Orex developed the property with further drilling and the refurbishment of its existing underground infrastructure, but also optioned the property to Placer Dome.

In 1995, Placer Dome optioned Goldboro with the objective of determining whether the property could be mined as an open pit operation. To determine this, they would focus on exploring for low-grade gold mineralization in the Boston-Richardson arenite or hanging wall sequence in the range of 0.5 g/t to 1.0 g/t.

Placer Dome was unsuccessful in their pursuit as they let their option on the property expire. They are quoted as saying,

” the property did not meet corporate requirements with respect to large open pit mining opportunities” ~ 2014 Goldboro PEA – pg.63

In 2010, Orex and Osisko formed a joint venture partnership for the exploration of Goldboro. Together, they drilled 59 NQ-sized drill holes with a combined length of close to 13,000m. The data from the drill program provided in-fill data to the property drillhole database.


Goldboro Gold Mineralization

Goldboro is entirely underlain by sedimentary rocks of the Goldenville Group, which are made up of greywacke, arenite and slate. Gold mineralization is found in quartz veins and within disseminated sulphides in the wall rock.

From the 2014 Goldboro PEA,

” Gold mineralization at Goldboro occurs in quartz veins and wall rocks adjacent to the veins. At the deposit scale, the veins form a swarm and are clearly located in the flexure zone (hinge and adjacent limbs) of the Upper Seal Harbour anticline. The gold-bearing veins are found in a 140- to 160-m wide envelope centred on the axial surface. The veins occur mostly on the limbs of the fold, but also in the hinge, and all are hosted by turbiditic metasedimentary rocks consisting of metagreywacke, arenite and slate.” ~2014 Goldboro PEA – pg.51


Goldboro Deposit Cross-Section

Source: 2014 Goldboro PEA – pg.48

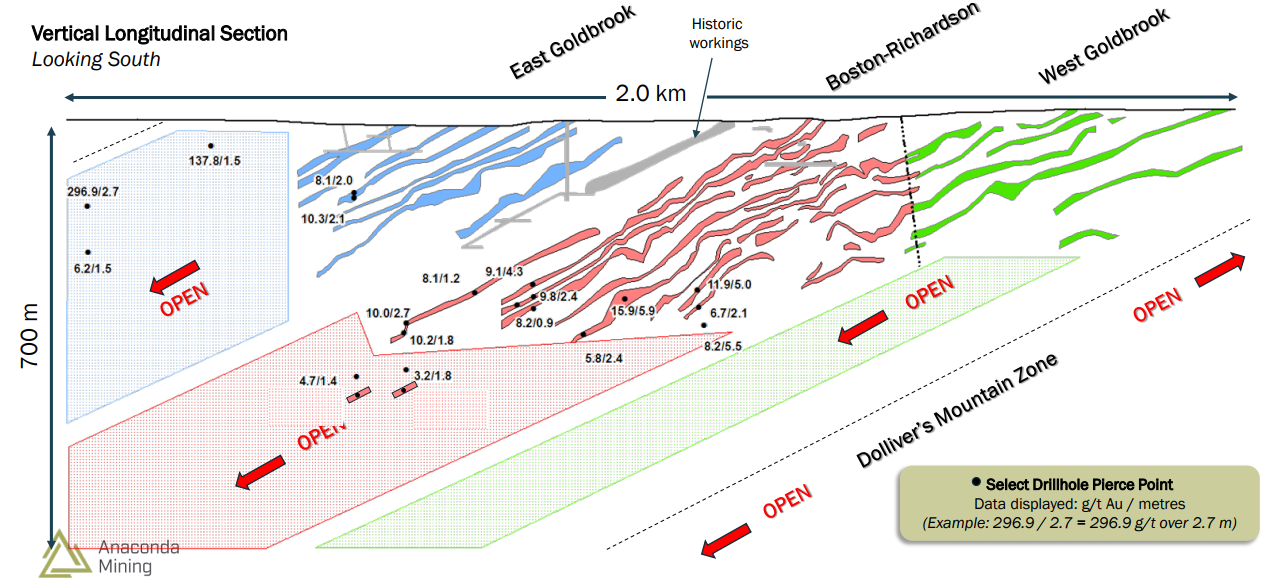
Goldboro’s deposit is broken down into three main areas, the Boston-Richardson gold system and the East and West Goldbrook gold systems. Currently, the deposit’s known strike length is 1.6 km and is associated with a geophysical anomaly. This anomaly extends east and west beyond the current known strike length of the deposit.

Goldboro IP Chargeability Map

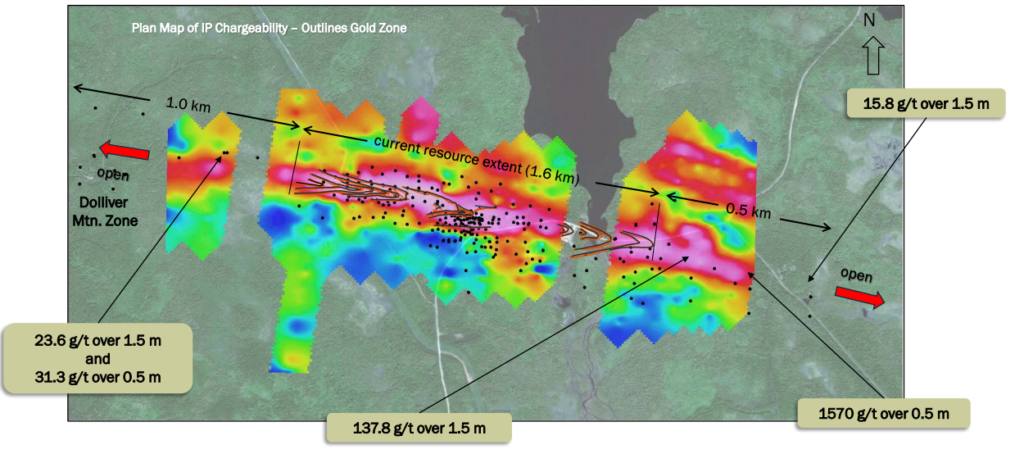
Source: Anaconda Mining – Slide 14

The IP anomaly and the fact that historical drill results from those prospective areas east and west of the known strike length, led Anaconda geologists to believe that there is potential to expand the Goldboro Deposit east and west along strike.

Goldboro Deposit Vertical Longitudinal Section

Source: Anaconda Mining – Slide 13

PUSH: Anaconda plans to drill Goldboro this fall, with the intent of both expanding the resource and shoring up the existing deposit.

Goldboro Resource

Source: 2014 Goldboro PEA – pg.13


Boston-Richardson Gold System

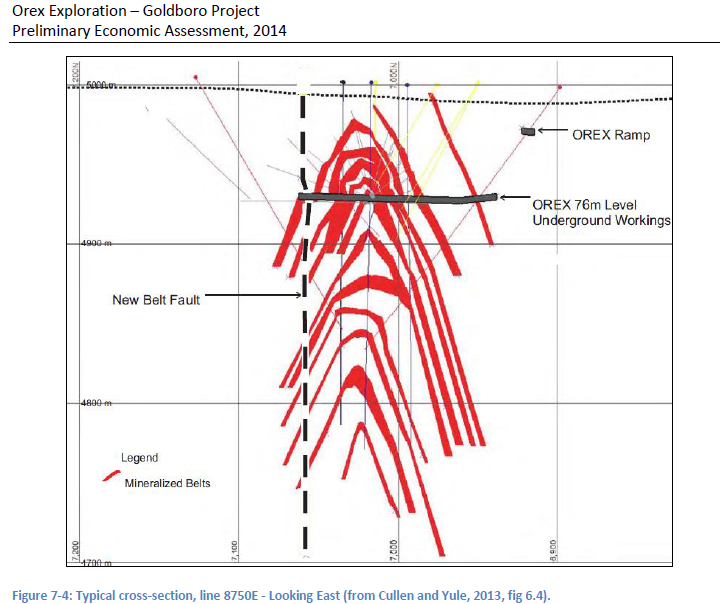
As described earlier in the article, the Boston-Richardson (BR) gold system was the first mineralization discovered and mined on the property, along with being the host of the existing underground infrastructure.

The BR Belt is host to 15 tightly-stacked, high-grade, gold bearing vein zones. The zones are characterized by thick gold bearing quartz veins and thin veins arrays within the highly altered argillite, separated from the neighbouring vein zones by un-mineralized greywacke.

The BR Belt has been modelled to a depth of  350 metres and plunges eastward beneath East Goldbrook. Anaconda believes that the deposit continues at depth, as some historical drill results have retuned results with high grade and widths at depth in the eastern portion of the deposit.


East Goldbrook Gold System

East Goldbrook is host to 7 stacked vein zones, but has not seen the amount of drilling that the BR gold system has and, therefore, is home to the majority of the deposit’s inferred resource. Drill holes are broadly spaced at intervals of roughly 100 metres. Like the BR system, Anaconda believes that given historical drill results, a portion of the veins in East Goldbrook, extend farther west, beyond what is currently modelled.


The Nugget Effect

Interestingly, the Goldboro gold mineralization is subject to what they call the Nugget Effect, where the gold is present in large nuggets, fine disseminations within the wall rock and fine gold grains associated with carbonaceous material.

The nugget effect can both inflate and deflate the sampling results. However, a lot of work on Goldboro has focused on better understanding this effect, including undergoing  multiple instances of twinning drill holes in an attempt to validate results, drilling samples with a larger HQ-sized diamond drill core, plus the use of field duplicates, certified reference standards and field blanks were used during their 2008 program.

A.S. Horvath Consulting remarks,

“At Goldboro, historic conventional sampling, processing and analytical gold determination protocols consistently under-estimate the grade due to the extreme nugget effect.” ~ 2014 Goldboro PEA – pg.83


Anaconda’s Plans for Goldboro

Anaconda has a tremendous advantage when it comes to developing the Goldboro Project, as they’re the owner and operator of the Pine Cove Mill. Theoretically, the ore mined at Goldboro can be shipped via the tide water port, in Isaac’s Harbour, to Anaconda’s Pine Cove Mill on the Baie Verte Peninsula in Newfoundland & Labrador for processing.

A bulk sample of Goldboro ore is planned for completion in early 2018 and will test the Pine Cove Mill’s ability to recovey the gold from the ore. The successful completion of the bulk sample will be a major accomplishment by the Anaconda team and one that we, as investors, should pay close attention to.

The 2014 PEA on Goldboro estimated the total CAPEX cost for development, expansion and the sustaining of the Goldboro Project to be $46.4 million USD. Considering this cost, the estimated Net Present Value (NPV) at a 7.5% discount is $80 million USD, with an Internal Rate of Return (IRR) of 52% at $1200 USD/oz gold.

Within the PEA, one of the projected CAPEX costs is for processing equipment and the tailings management facility, which accounted for $16.1 million USD or 35% of the total cost. Therefore, although this is a crude estimate, the CAPEX costs in the newly proposed scenario of shipping the ore to the Pine Cove Mill may come closer to $30 million USD, which gives the project a lot of breathing room, as far as profitability is concerned.

PUSH: With the future mine production processing moving to the Pine Cove Mill and the additional drilling completed by Anaconda this fall, and a new PEA on the project by December of 2017, should provide us with a view of the potential profitability of this new arrangement.

Additionally, Anaconda has a few other goals to complete for the Goldboro Project this fall and winter, including: Complete an archeology study report, Mik’maq ecological studies, and environmental baseline studies for the property.


Summarizing the important points on The Goldboro Project:

  • The Goldboro deposit is open along strike, in both directions and at depth. Anaconda will be drilling the property this fall in an attempt to increase the resource size and infill drill the areas of the deposit where further information is needed.
  • The metallurgical drill program is completed and testing is underway. A bulk sample of the Goldboro ore is planned to be completed by early 2018 and will be a great indication of gold recoveries for the project.
  • A PEA of Anaconda’s Goldboro Project will be completed by December of this year. Given the savings provided by Anaconda’s existing Pine Cove Mill, it will be interesting to see how it translates into the project’s potential profits.


The Viking Project

The Viking Project is set on 6,225 hectares of property located roughly 180 km by road from the Pine Cove Mill and 10 km southwest of Pollards Point and Sop’s Arm in White Bay, on the island of Newfoundland.  The Project is underlain by rocks of variable age that are separated along the large-scale Doucers Valley Fault System.

The Viking Project has two main properties within it, The Kramer property and The Viking property. The mineralization and alteration on the Kramer property are developed in the Main River Plutonic rocks and adjacent Cambro-Ordovician quartzites. The Viking property’s mineralization and alteration are developed in potassium-fieldspar megacrystic to augen granodiorite of the Main River Pluton.


Kramer Property

Historic exploration on the Kramer property was conducted by BP Resources in 1987 and Spruce Ridge Resources from 2009 to 2013. The property has seen soil sampling, geological mapping, airborne magentics, VLF-EM, trenching and diamond drilling. Currently, gold mineralization is defined over a strike length of 1.3 km and remains open to the northeast and southwest. Some of the drilling highlights include 3.78 g/t gold over 5.15 m and 25.41 g/t gold over 0.5 m.


Viking Property

Historic exploration on the Viking property was conducted by BP Resources in 1987, Noranda from 1988 to 1990, Altius Minerals in 2006, and Northern Abitibi from 2007 to 2011. Like the Kramer property, Viking has seen soil sampling, geological mapping, airborne magentics, VLF-EM, trenching and diamond drilling, but to a much higher degree, with 62 trenches and 131 holes totalling almost 19,000 m.

Mineralization has been found along the Thor and Viking Trends. The Thor Deposit has a historical 43-101 resource estimate of 63,000 ounces of gold at 2.09 g/t in the Indicated category and 20,000 ounces of gold at 1.79 g/t in the Inferred category, however, Anaconda does not consider this to be a current mineral resource as an Anaconda Qualified Person has not completed sufficient work to classify it as a current mineral resource. See SEDAR for the technical report entitled, “MINERAL RESOURCE ESTIMATE UPDATE FOR THE THOR TREND GOLD DEPOSIT, NORTHERN ABITIBI MINING CORP”.


Additional Projects

Additionally, Anaconda has the Great Northern Project and Tilt Cove property which are very early stage projects. These will not be covered in this report, please see their respective web pages for further information.


Anaconda Mining Financials

Anaconda’s fiscal year report was released on August 25, 2017 and covered the company’s financial and operating results for the fiscal year ended on May 31, 2017. Here is a look at some of the important high level figures (Note: figures have been rounded and are in CAD unless otherwise stated)

  • Production – 15,562 ounces of gold at an average sale price $1,651/oz or USD $1,248/oz
  • Point Rousse Project EBITDA – $8.0 million
  • Consolidated EBITDA – $6.3 million
  • Revenue Generation – $25.7 million
  • Total cost of operations – $24.8 million at an operating cash cost per ounce of $1,126/oz or USD $856/oz
  • All-in Sustaining Cost (AISC) – $1,735/oz or USD $1,318/oz
  • AISC includes corporate administration, capital expenditures (CAPEX) and exploration costs
  • CAPEX included tailings and polishing pond construction of $1.9 million, mill equipment upgrades of $0.7 million, production stripping asset additions of $1.1 million and dock facility permitting/legal costs of $0.1 million
  • Exploration and evaluation costs were high, with purchase of Orex Exploration, as the company conducted its due diligence. Additionally, exploration of all Anaconda properties totalled $3.3 million for the fiscal year, as drilling, trenching, mapping and mineral resource estimates were completed.
  • Mine Operating Income – $900K
  • Expenses and other Income – $2 million
  • Loss before Income Tax – ($1.1 million)
  • Net Loss and Comprehensive Loss for the Period – ($3.6 million) or $0.02 Net Loss per share
  • Net Loss for the fiscal year is attributed to higher non-cash charges including depletion and depreciation expense and deferred tax expense.
  • Weighted average number of shares – 210,921,901


Anaconda Mining is a company in a major growth stage of its development, and their financials reflect it in their net loss for the fiscal year. However, this loss comes with the development of their projects: Point Rousse and Viking, and includes the transformative purchase of the Goldboro Project, which should pay back in a big way once in production. The upcoming PEA should provide us with a relatively clear guideline of how lucrative Goldboro will be.

Bottom line is that the Point Rousse Project creates a cash flow which the company can deploy into its other assets for development. This is a situation which many other companies try and foreshadow, but Anaconda is actually doing it.


Anaconda Comparables

Who are Anaconda’s comparables? This is a great question, one that is hard to answer for a number of reasons. One thing that I try and keep constant when comparing companies is jurisdiction, as this is a huge wildcard and arguably has the largest speculative affect on the value of a company.

Therefore, I will be comparing Anaconda to two companies, one in Newfoundland & Labrador and the other in Nova Scotia. While the two companies aren’t currently producing gold, I feel they are as close to comparables as you can get for Anaconda on Canada’s east coast.

NOTE: These calculations are approximations and shouldn’t be counted on as being exact or reflecting the enterprise values at the time of reading this report.


Anaconda’s Enterprise Value per Ounce of Gold

Before getting to the comparisons, let us take a look at Anaconda’s Enterprise Value in relation to their 43-101 Resource.

MCAP at the time of writing – roughly $28.6 million CAD

Cash – As reported in Anaconda Corporate Presentation dated August 2017 , reflecting fiscal year end on May 31, 2017- $2.5 million CAD

Debt – As reported in Anaconda Corporate Presentation dated August 2017 , reflecting fiscal year end on May 31, 2017- $1.0 million CAD

Therefore, Anaconda’s Enterprise Value (EV) = 28.6 + 1.0 – 2.5 = $27.1 million CAD

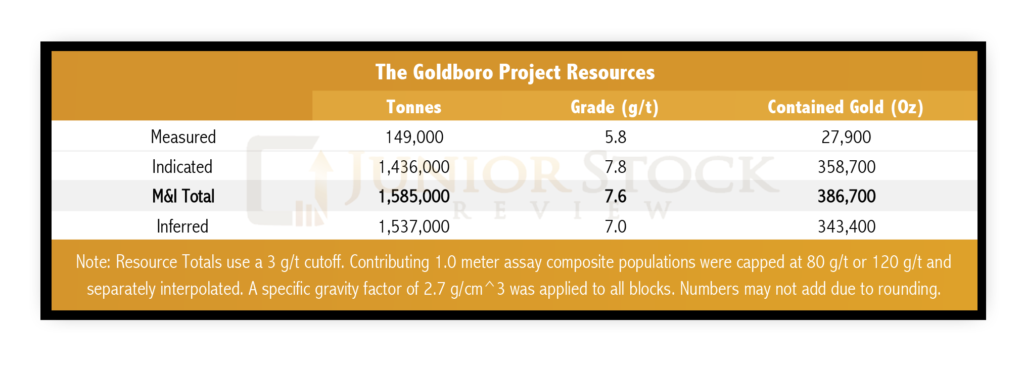
43-101 Total M&I + I Resource = 1.1 million ounces of gold

Therefore, EV / Resource = 27.1 / 1.1 = 24.6


Marathon Gold (MOZ:TSX)

The first company is Marathon Gold, which owns the Valentine Lake Gold (VLG) property in Newfoundland. The VLG property, is being developed as an open pit mine, which may be later converted to an underground operation. VLG has a 43-101 Measured and Indicated Resource of roughly 1.4 Moz of gold and an Inferred Resource of 0.8 Moz of gold, giving VLG a total of 2.2 Moz of gold.

MCAP at the time of writing – roughly $145 million CAD

Cash – As reported in Marathon’s Financials dated June 30, 2017  – $21.1 million CAD

Debt – As reported in Marathon’s Financials dated June 30, 2017  – $0 million CAD

Therefore, Marathon’s Enterprise Value (EV) = 145 – 21.1 = $123.9 million CAD

43-101 Total M&I + I Resource = 2.2 million ounces of gold

Therefore, EV / Resource = 123.9 / 2.2 = 56.3


Atlantic Gold (AGB:TSXV)

The second company is Atlantic Gold, which owns 4 gold development projects in Nova Scotia. Atlantic’s Touquor Project is its most advanced project, with open pit mining production slated for October 2017. Atlantic Gold has a 43-101 Measured and Indicated Resource of 1.7 Moz of gold and an Inferred Resource of 0.4 Moz of gold, for a total of 2.1 Moz of gold.

MCAP at the time of writing – roughly $277 million CAD

Cash – As reported in Atlantic’s Financials dated June 30, 2017  – $11.5 million CAD

Debt – As reported in Atlantic’s Financials dated June 30, 2017  – $128.3 million CAD

Therefore, Atlantic’s Enterprise Value (EV) = 277 + 142.2 – 11.5 = $407.7 million CAD

43-101 Total M&I + I Resource = 2.1 million ounces of gold

Therefore, EV / Resource = 407.7 / 2.1 = 194.1


While ounces in the ground are not created equal, using a comparison method such as EV/Oz is a great way to gauge the valuations of companies of similar ilk. In this case, I think it’s clear that Anaconda is undervalued in comparison to Marathon Gold and Atlantic Gold.

Anaconda’s production is small at approximately 16,000 ounces per year, but they are in full production and have acquired a project in Goldboro, which looks to bring them to the next level of gold producers. I expect Anaconda’s market capitalization to be re-rated in the near future, as its story becomes more widely known.


Concluding Remarks

In conclusion, Anaconda Mining is an under-valued gold producing company, which I believe is set for a MCAP re-rating in the months ahead. To refresh your memory, here’s a list of the contributing factors:

  • Anaconda has a great team of professionals led by CEO, Dustin Angelo.  The Goldboro Project acquisition and further acquisitions in the future will cement Anaconda’s reputation as a premier gold producing company
  • Anaconda Mining’s assets are located in the provinces of Newfoundland & Labrador and Nova Scotia, Canada. These are premier destinations for mining with a stable political landscape and world-class geology
  • Anaconda achieved gold sales totalling 15,562 ounces in the fiscal year ended on May 31, 2017. The gold was produced at the Point Rousse Project, which includes Pine Cove Mill and Mine
  • An existing 43-101 Measured & Indicated + Inferred Resource Total of 1.1million ounces of gold
  • Their EV/Oz is well below similar gold companies developing properties on the east coast of Canada
  • PUSH: Anaconda plans to drill Goldboro this fall and intends to expand the resource and shore up the existing deposit.
  • PUSH: A PEA on the Goldboro Project will take place by the end of 2017, giving us an idea of the potential profitability.


Don’t want to miss a new investment idea, interview or financial product review? Become a Junior Stock Review VIP now – it’s FREE!


Until next time,


Brian Leni  P.Eng

Founder – Junior Stock Review


Disclaimer: The following is not an investment recommendation, it is an investment idea. I am not a certified investment professional, nor do I know you and your individual investment needs. Please perform your own due diligence to decide whether this is a company(s) and sector that is best suited for your personal investment criteria. Junior Stock Review does not guarantee the accuracy of any of the analytics used in this report. I do own Anaconda Mining Inc. and Marathon Gold Corp. shares. Anaconda Mining Inc. is a Sponsor of Junior Stock Review.

Posted on

The Nickel Market: Investing Ahead of the Crowd – Part 1

Nickel Supply Versus Demand

First and foremost, the way to make money on a consistent basis in the junior mining sector is to buy quality. Chasing what is hot in the market typically means you are too late to the story. However, in my opinion, it’s still necessary to have a good idea of where the commodity is within the cycle, as buying near the bottom of the cycle will tilt the odds of success in your favour.

Today, we’re going to look at a base metal market which has been beat up over the last few years, but may be on its way up. This metal is nickel, one of the most important metals of our industrial world.

For the most part, nickel has been somewhat off the radar in the resource investment world; in the 4 years preceding 2016, the nickel market was over-supplied with nickel ore, sending the nickel price to 5 year lows under $4 USD/lbs.

2016 may have marked the bounce back in nickel prices for a number of reasons that we will get into later on in this report. Before we get into the supply and demand fundamentals, let’s take a look at some basic geological background information on the metal.


Nickel Ore

In the U.S. Geological Survey’s(USGS) 2017 review, it states that the world has 78 million metric tons of nickel reserves and produced roughly 2.25 million metric tons of nickel ore in 2016.

Global Nickel Reserves

Source: US Geological Survey

Nickel is most often found in two types of ores, sulfides or laterites. While nickel laterite ores are more commonly found in the world, they are mined less than nickel sulfide ores, which make up the vast majority of current and historical production.

Laterites are formed near surface, typically in tropical regions, where high rainfall and higher temperatures have released the nickel from ultramafic rocks, forming highly leached soils.  Laterite deposits are commonly found around the equator, for example the Philippines, Indonesia, Western Australia and southern Africa.

Nickel laterite ores are mined less often than sulfide ores because they require more extensive and more complicated processing to extract the nickel. Higher cost of production means these deposits typically sit and wait for higher nickel prices to make them economic.

Nickel sulfide ores are associated with ultramafic rocks, which sit near the surface. It’s theorized that during formation, ultramafic flows picked up sulphur droplets from adjacent rock. As the sulphur droplets moved through the ultramafic flow, they collected nickel, copper and other platinum group metals. Thus, we’re left today with nickel sulphide deposits that commonly have these other metal types.


A Conversation with Martin Turenne

I had the chance to ask FPX Nickel CEO, Martin Turenne, a series of questions pertaining to the global nickel market. Highlights from our interview will be shared throughout the report.


FPX Nickel Corp.

FPX Nickel Corp. (FPX:TSXV)

MCAP – $13.4 million CAD (at the time of writing)

CEO – Martin Turenne


FPX Nickel is developing its flagship Decar nickel project, located in central British Columbia, Canada.  The Decar project is a greenfield discovery of nickel mineralization in the form of a naturally occurring nickel-iron alloy called awaruite.


Nickel Supply Analysis

Nickel ore is mined all across the world, however, the majority of current production is concentrated in a few keys areas: the Philippines, Russia, Canada, Australia, New Caledonia and Indonesia.

As a country, the Philippines represents roughly 20% of the world’s nickel production. Rewinding back to 2013, global nickel production looked much different, as Indonesia was the largest producer in the world, representing an overwhelming 34% of the market. However, this changed very quickly in 2014.


Indonesia’s Nickel Ban

Why did Indonesia’s production fall in 2014? In a nutshell, the Indonesian government instituted a ban on nickel ore exports in an effort to encourage investment in downstream nickel ore smelting operations.  Prior to 2014, China, the largest importer of Indonesian nickel ore, would ship the raw nickel ore back to its smelters, where it would be processed into nickel pig iron (NPI).

NPI is a ferronickel product, the creation of which is credited to China, and it can be used in the making of stainless steel.  Stainless steel producers have a choice between using NPI or pure nickel in their process, however, NPI is typically a cheaper alternative.

NPI is created using low grade, laterite nickel ores which are mixed with coking coal and a mixture of fluxes. The process culminates in a blast furnace, which renders the unwanted impurities into slag and allows the molten mixture to be cast into molds, forming nickel pig iron.

While the Chinese provided Indonesia’s nickel mines with steady demand for the ore, the Indonesian government wanted more from the industry and, thus, in 2014 issued a ban on the exporting of nickel ore.

To date, it would appear that this ban hasn’t worked out as well as the Indonesian government would have hoped, as earlier this year they relaxed their stance on nickel ore exports, saying that some approved, low grade (less than 1.7% Ni content) nickel ores could be released into the market, provided the buyer expresses a commitment to build a smelting operation in Indonesia within five years.

Considering this, I asked Martin the following:

Question 1:

In your opinion, will the Indonesian government further relax or lift their nickel ore export ban and how will that affect the global nickel market?

Martin: If the Indonesian government wants to encourage greater investment in domestic smelting capacity, it will not further relax or lift the export ban. When the export ban was relaxed earlier this year, the nickel price dropped; the Indonesian Smelter Association has since reported the closure of 13 out of 25 Indonesian nickel pig iron (“NPI”) smelters due to low nickel prices. So relaxing the ban has defeated the purpose of its initial implementation, which was to encourage investment in new smelter capacity. The relaxation of the export ban has actually had a relatively neutral impact on global nickel supply this year; to the extent the ban is further relaxed, any increase in Chinese NPI production is largely offset by lower Indonesian NPI production, and this limits the potential for further development of Indonesian NPI smelters going forward.


The Environment and its Effect on the Nickel Market

I don’t think it should come as a surprise to anyone that the environment and how we live in it is becoming a larger political issue around the world with each passing day. A large segment of the population is demanding both industry and individuals reduce their impact on the environment, mainly via reducing carbon emissions.

The Paris Accord and the 450 Scenario are two examples of organized attempts to bring countries together in addressing our impact to the environment. While many countries have embraced these hefty goals for carbon emissions, there are still countries that choose not to conform to the trend, as well as others who are walking to the beat of their own drum by setting their own goals and plans to achieve them.

China has long been associated with poor air quality in its cities, an unfortunate trade-off for the country’s massive manufacturing industry. This trade-off has long been accepted, but this sentiment is quickly changing, as the Chinese government has begun to target industries that contribute significantly to air pollution, forcing them to shut down or improve their process.

Earlier this year, I wrote about the effect this has had on China’s zinc smelting operations and how that loss of smelting capacity has further contributed to the supply crunch in the zinc market. Nickel is no different, as, most notably, the Philippines are shutting or suspending nickel operations in an effort to reduce the industry’s affect on the environment.

The Philippines is particularly interesting in the nickel space, because they are by far the largest producer of nickel ore in the world. Anglo America states,

“The Philippines has ordered many nickel mines to shutdown, or to suspend operations, accounting for [roughly] 50% of the country’s annual output,  [roughly] 10% of world mine supply” ~ April 2017 Nickel Perspectives Presentation – Slide 7

Further, the Philippines Department of Environmental and Natural Resources’ (DENR) Environmental Secretary, Gina Lopez, said in reference to the mine closures and their environmental impacts,

“My issue here is not about mining. My issue here is social justice. If there are businesses and foreigners that go and utilize the resources of that area for their benefit and the people of the island suffer, that’s social injustice.” ~ DENR


Philippine Ban on Nickel Ore Exports?

In recent developments, as reported by Channel NewsAsia on August 25, 2017,

“Philippine lawmakers have filed a bill seeking to ban mining in watershed areas and exports of unprocessed ores and will require miners to get legislative approval before operating, in line with President Rodrigo Duterte’s pledge to overhaul the sector.”

This would have major implications on the nickel market if it becomes official policy. As stated earlier, the Philippine government had already started to suspend and shut down mining operations due to their affect on the environment. Taking it a massive step forward is incorporating a ban on the export of unprocessed ore.

We need to keep a close eye on this, because in my mind, this makes the nickel narrative very bullish.


Question 2:

Brian: In what appears to be a growing trend, the Philippines have ordered the suspension or closure of roughly 50% of their nickel producing mines due to environmental concerns.

In your opinion, will the environment continue to play a role in the global nickel market moving forward, or are the actions by the Philippine government an isolated situation?  If this is just the tip of the iceberg, how do you foresee it affecting future nickel supply?

Martin: The environmental factor could be significant going forward, because mining practices in the Philippines can be pretty gruesome for the local ecosystem, and the move to suspend operations has very vocal support from Filipino President Duterte and local populations. Beyond that, we have recently started to see some curtailing of NPI smelting operations in China, which are very dirty operations. Given China’s current crackdowns on polluting industries, and given that the country has capacity to produce up to 20-25% of global refined nickel supply, smelter shutdowns there are significant for the market.


Nickel Producers by Company

Top 10 World Nickel Miners

Source: Statista

Two companies stand above the rest when it comes to world nickel production, Vale and Norilsk Nickel. Combined, they control more than a quarter of the nickel produced in the world, let’s take a look at these two companies.


Vale  (VALE:NYSE)

Share Price – $10.17 USD (at the time of writing)

MCAP – $52.4 Billion USD

Vale is a major resource company with a variety of different areas of business: mining, logistics, energy and steelmaking.  While they have multiple cash flow sources, they are primarily a mining company.  As a mining company, they have operations that mine iron ore, nickel, coal, copper, fertilizers and manganese/ ferro-alloys.

Currently, Vale is the largest producer of nickel ore, with 14% of the global market.  Vale’s nickel operations are in Brazil, Canada, Indonesia and New Caledonia. Also, Vale is a refiner with both fully owned and joint venture operations in China, South Korea, Japan, the United Kingdom and Taiwan.

One of Vale’s largest footprints is in Canada with offices or mining operations in the following cities: Toronto, Sudbury, Port Colborne, Thompson, St. John’s, Voisey’s Bay and Long Harbour.

  • Vale’s Sudbury location employs roughly 4000 people and is one of their largest properties with six mines, a mill, a smelter, and a refinery. Along with nickel, the mines also produce copper, cobalt, platinum group metals, gold and silver.


Norilsk Nickel  (MNOD:LSE)

Share Price – $15.35 USD (at the time of writing)

MCAP – $24.14 Billion USD

Norilsk is a Russian company and the 2nd largest nickel producer in the world. As their name would suggest, nickel is their primary focus, however, they do produce a number of other metals, including: palladium, platinum, copper, cobalt, rhodium, silver, gold, iridium, ruthenium, selenium, tellurium and sulphur.

Norilsk’s main mining operations are as follows:

  • Polar Division – Located in Russia, north of Arctic Circle. The Polar Division has 4 mines which produce sulfide copper-nickel ores.
  • Kola MMC – Located in Russia, near the border with Norway and Finland. Kola has sulfide disseminated ores mainly containing nickel and copper.  The ore is then processed into a collective copper-nickel concentrate. Kola’s refining facilities can then create electrolyte nickel and copper, carbonyl nickel, cobalt concentrate and precious metals concentrates.
  • Norilsk Nickel Finland – Located in Finland, it is the only refining plant in the country. The refinery processes nickel concentrates from Norilsk’s other operations.
  • Norilsk Nickel Australia – Operations are currently suspended.
  • Norilsk Nickel Africa – 85% ownership of Tati Nickel Mining Company in Botswana and 50% ownership in Nkomati in South Africa.


Question #3

Brian: The major mining companies are typically a great gauge for the supply and demand fundamentals in their given sector.

In your opinion, from the information they are disseminating, where is the nickel market currently and where is it headed?

Martin: In terms of market fundamentals, all the analysts and the major companies are aligned in predicting supply deficits for the next several years and rising nickel prices. You just have to look at the deficit forecasts recently disclosed by Norilsk and Sumitomo Metal Mining, to name just two. We are also seeing companies like Glencore and BHP very publicly highlighting the growth in nickel demand from electric vehicle batteries, and the hugely bullish implications of that for the nickel price. Finally, we are starting to see majors starting to look for growth opportunities for their nickel businesses; that’s a common theme we hear when speaking to those companies and to investment bankers in the industry. As the nickel price continues to strengthen, that urgency to acquire new projects will pick up considerably.


Question#4

Brian: Mines are depleting assets and, therefore, regardless of where we are in the bull or bear cycle, the major mining companies, when push comes to shove, have to replenish their coffers with more pounds or ounces of metal on a continuous basis.

Roughly, 60% of the world’s nickel production is from major mining companies, which, in my mind, means that good nickel deposits are typically bought up in the market by the majors versus being developed by the junior that discovers them.

How close and what do you believe will be the catalyst for the next merger and acquisition rush in the nickel sector? Please explain.

Martin: Just one year ago at this time, mid-tier and major companies in base and diversified metals were still focused on repairing their balance sheets and in divesting non-core assets; growth wasn’t on their radar at all. With the subsequent run in the prices of base metals and bulks, those same companies are now generally very profitable again, and given that their pipeline of new projects is relatively empty, they are actively seeking growth opportunities and looking to add new development projects to their portfolio. We’ve started to see a few mid-tiers and majors investing into copper and zinc projects, and I would expect you will see them looking to add nickel assets into their portfolio next. The fact that there’s been so little investment in base metal projects in the past few years bodes extremely well for companies like FPX Nickel – companies with large, low-cost development-stage assets located in attractive jurisdictions.


Nickel Mine Production Changes

Existing and newly approved nickel mining operations are projected to show an average yearly increase of roughly 440,000 tonnes of production leading up to 2020. Let’s take a look at a few of the largest contributors by country.

  • Indonesia is set to have the largest yearly increase in production with an average of roughly 258,000 tonnes of laterite ore over the next 4 years.  Indonesia’s expected production increase is directly related to the low-grade ore which will exported.
  • Guatemala’s Fenix Mine is projected to show an average yearly increase of 27,000 tonnes of laterite ore over the next 4 years. The Fenix Mine was reopened in 2014 after 30 years of closure due to disputes over land ownership.
  • Finland’s Talvivaara (Sotkamo) and Kevitsa Mines are set to increase yearly production on average by 25,800 tonnes of sulphide ore over the next 4 years.  The Talvivaara Mine will show the bulk of the increase in production. It is located in Sotkamo, and is mined by Talvivaara Mining Company, a company which has had its share of issues, including bankruptcy in 2014 and a tailings spill. The company has since signed a 10 year deal with Norilsk Nickel, which will buy all of its nickel and cobalt production over the contract period.
  • Australia’s Nova-Bollinger Mine is projected to increase its average yearly production by 20,400 tonnes of sulphide ore over the next 4 years. The Nova-Bollinger Mine is owned and operated by Independence Group, which is an ASX listed diversified mining, development and exploration company.


A decline in the yearly production of currently producing nickel mines is projected to average 270,000 tonnes leading up to 2020. Here’s a look at some of the larger reductions in nickel production from around the world.

  • Australia’s Long and Savannah Mines are expected to decrease their yearly production by a combined average of roughly 10,000 tonnes until 2019 and 2020 where that will double to 20,000 tonnes.  The Long mine is owned and operated by Independence Group, which purchased the project in 2002 from BHP. The Savannah Nickel & Cobalt Mine is owned and operated by Panoramic Resources. All of the mineral concentrate produced by the Savannah mine is contractually sold to Jinchuan Group, one of the world’s largest nickel companies.
  • Brazil’s Mirabela and Niquel Tocantins Mines’ yearly production is expected to decrease by a combined 46,000 tonnes per year leading up to 2020.
  • Guatemala’s Montufar – Garnierite Mine is expected to decrease its average yearly production by 20,000 tonnes over the next 4 years.


Subtracting the projected decreases to increases in production, by 2020, the yearly available supply should roughly increase by 174,000 tonnes. However, a major wild card in this estimate is the actions by the Filipino and Indonesian governments. They hold a lot of influence on the future supply numbers, positive or negative.


Global Reported Nickel Inventories

When examining the supply numbers for any of the industrial metals, it’s important to check the inventory levels held by the London Metal Exchange (LME), Shanghai Futures Exchange (SHFE) and bonded warehouses.


London Metal Exchange

For those who aren’t aware, the LME is a major world centre for the trading of futures contracts in industrial metals. Established in 1877, the LME has a long history in the metals industry and, thus, has a great network of warehouses around the world.


Shanghai Futures Exchange

The SHFE is Asia’s answer to the LME, as it allows for futures contracts trading of a number of different commodities, which include:  gold, silver, copper, aluminum, nickel, steel rebar, zinc, etc.  While not being as old as the LME, the SHFE has become a major part of the global market, one that needs to be considered when researching any commodity.


Total Nickel Inventory Levels

Examining the total global nickel inventory, you see that they are down 15% from the April 2016 peak, and down 10% year-to-date in 2017. Currently, total global inventories sit just below 500,000 tons. (Source: ScotiaBank and RBC Capital Markets) Contrasting this against 2016 production levels, which were 2.25 million tons, the current total global inventory represents roughly 22% or 3 months of annual production.

To note, the LME nickel supply makes up roughly 80% of the total global nickel inventory. For those interested, the LME inventory data is readily available on their site or on the Kitco site. The LME’s nickel 5 year stock level chart shows that since 2012, nickel inventories have grown from just over 100,000 tons to a high in 2015 of roughly 450,000 tons. However, since 2015, these stock levels have fallen down below 400,000 tons.


Question #5

Brian: LME nickel inventory levels have trended downwards after hitting a 5 year high in 2015. Current LME nickel inventory is sitting just below 400,000 tons, which is roughly 18% of 2016 world nickel production.

How much influence does the LME inventory supply have on the nickel price? Secondly, is there a key inventory level which can be looked at as critical to its influence on the nickel market?

Martin: Global reported inventories do have a big influence, and we are a ways off from reaching a critical level in terms of perceived tightness in nickel inventories. I think the important takeaway is that global reported inventory levels are down 15% from the peak in April 2016, which reflects the supply deficit in 2016 and 2017; so we have some very positive momentum in inventory draw downs and spot price escalation. More importantly, the analyst consensus is for more severe supply deficits over the next several years, which is the fundamental driver for an increase in prices going forward. Among the major metals, nickel has by far the most upside from the current spot price; the long-term consensus forecast price is around $7.50/lb, which means the price has to go up 45% to reach a stable long-term equilibrium, whereas the current spot price for copper and zinc is already at or above the long-term consensus forecast level. If you’re looking for the base metal with the most upside, nickel is the choice.


Nickel Supply Concluding Remarks

Like all commodities markets, the supply fundamentals of any particular metal are complicated, not only from a quantitative perspective, but also because these markets are so large and widespread. Their size and geography leave them very susceptible to the jurisdictional risk that we all stress about when investing in individual mining companies.

There were a number of topics discussed in the article, let’s recap some of the key nickel supply numbers and the factors affecting its current and future supply:

  • 2016 marked the first year in the last 5 where the nickel supply was out-stripped by demand.
  • Major nickel producers believe that we will see continued supply deficits and a rising nickel price over the next few years.
  • The Indonesian partial ban on nickel exports should continue as the country looks to develop its smelting industry.
  • The Philippines have suspended or closed roughly 50% of its annual nickel production due to environmental concerns. In 2016, the Philippines were the world’s largest nickel producer, given the current direction of government policy, this may not be the case in 2017.
  • Subtracting the projected decreases to increases in nickel production, by 2020, the yearly available supply should roughly increase by 174,000 tonnes. The Philippines and Indonesia are wild cards in this projection.
  • Total global nickel inventories are trending downwards, falling 15% to below 500,000 tonnes, since hitting a high in April of 2016.


The Philippines and Indonesian will have a major impact on the direction of the nickel price. If things remain status quo, it would appear that the nickel supply should continue to get out-stripped by demand.

However, we have only covered only one component of the equation; we need to look at nickel demand. What does the nickel demand look like, currently? From there, we can make some conclusions about where we think the market is headed. Stay tuned!


Don’t want to miss a new investment idea, interview or financial product review? Become a Junior Stock Review VIP now – it’s FREE!


Until next time,


Brian Leni   P.Eng

Founder – Junior Stock Review


Disclaimer: The following is not an investment recommendation, it is an investment idea. I am not a certified investment professional, nor do I know you and your individual investment needs. Please perform your own due diligence to decide whether this is a company(s) and sector that is best suited for your personal investment criteria. Junior Stock Review does not guarantee the accuracy of any of the analytics used in this report. I do own FPX Nickel Corp. shares. I have NOT been compensated to write this article.