Posted on

Looking Back at 2016 with Brian Leni, the Junior Stock Review

Junior Stock Review Logo

By Peter @Newton Bell, 29 December 2016

Following on our discussion of the Proust Questionnaire, Brian Leni and I turned our attention to the markets.  We talked about Brian’s series of articles on the uranium and lithium markets, and I learned that production from brines can vary greatly depending on weather. I put some questions to Brian about the implications of the cost declines of solar and we even talked briefly about the potential of thorium reactors! Find all that and more below.

>>

P: It’s the end of the year here – 2016 – and it’s been a wild year for our segment of the markets. We just had another rate hike here recently from the Federal Reserve, so I wonder if January 2017 will resemble the one just past.

B: Tough to say. Personally, I don’t know what to think.

P: I remember sitting there in January, watching things happening and being scared out of my wits!

B: I try not to focus on the short-term, but I think some things still make a lot of sense.  For example, the gold thesis has never been better. It’s still “not if, but when.” The short-term fluctuations are probably going to prove to be good buying opportunities as people realize you can’t just keep going into debt to solve our problems.

P: Developments around the world continue to be staggering. Whether its India overnight changes to what counts as legal tender, or all the stuff happening in the Middle East. There was some nasty news recently about Israel, an outcome that they didn’t want at the UN regarding Jerusalem.  Tensions in the Far East, too. And the USA approved a $600+ billion dollar military spending package a couple of days before Christmas. Same as it ever was, I guess.

P: You had a big piece out about lithium there, about the supply and demand fundamentals. Any comment on what it was like to do all that research there? (Lithium)

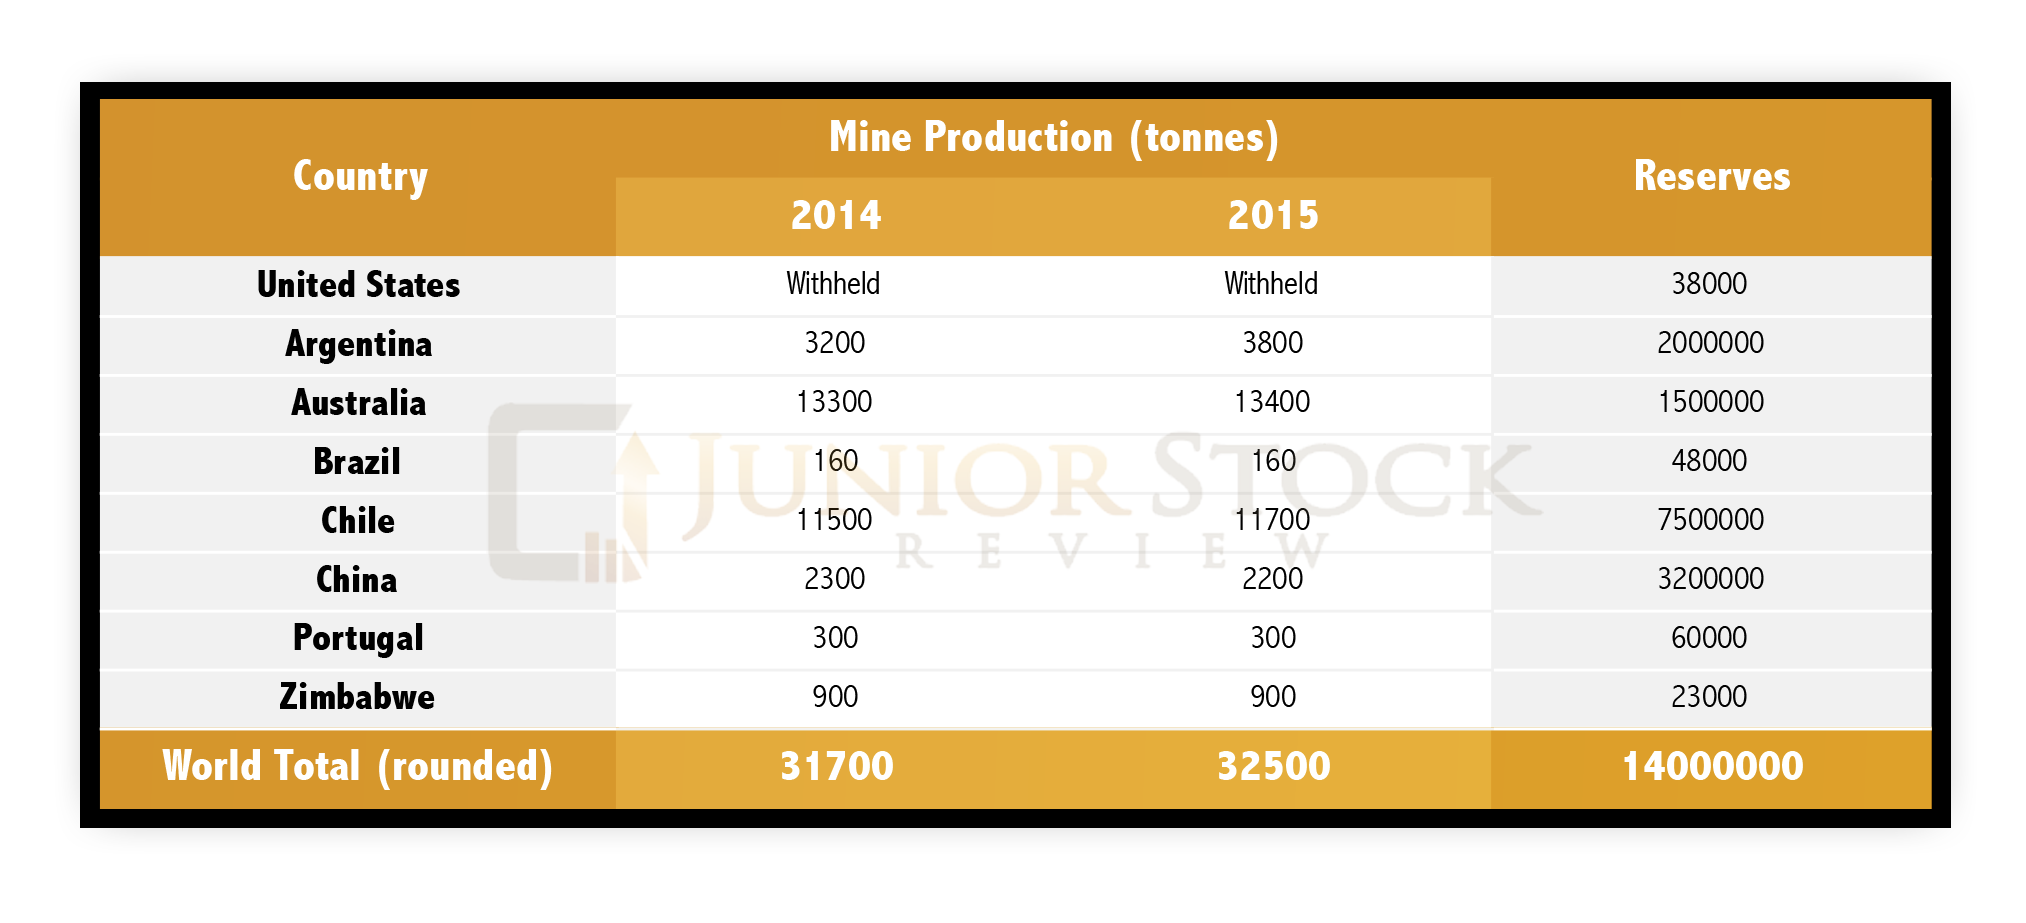
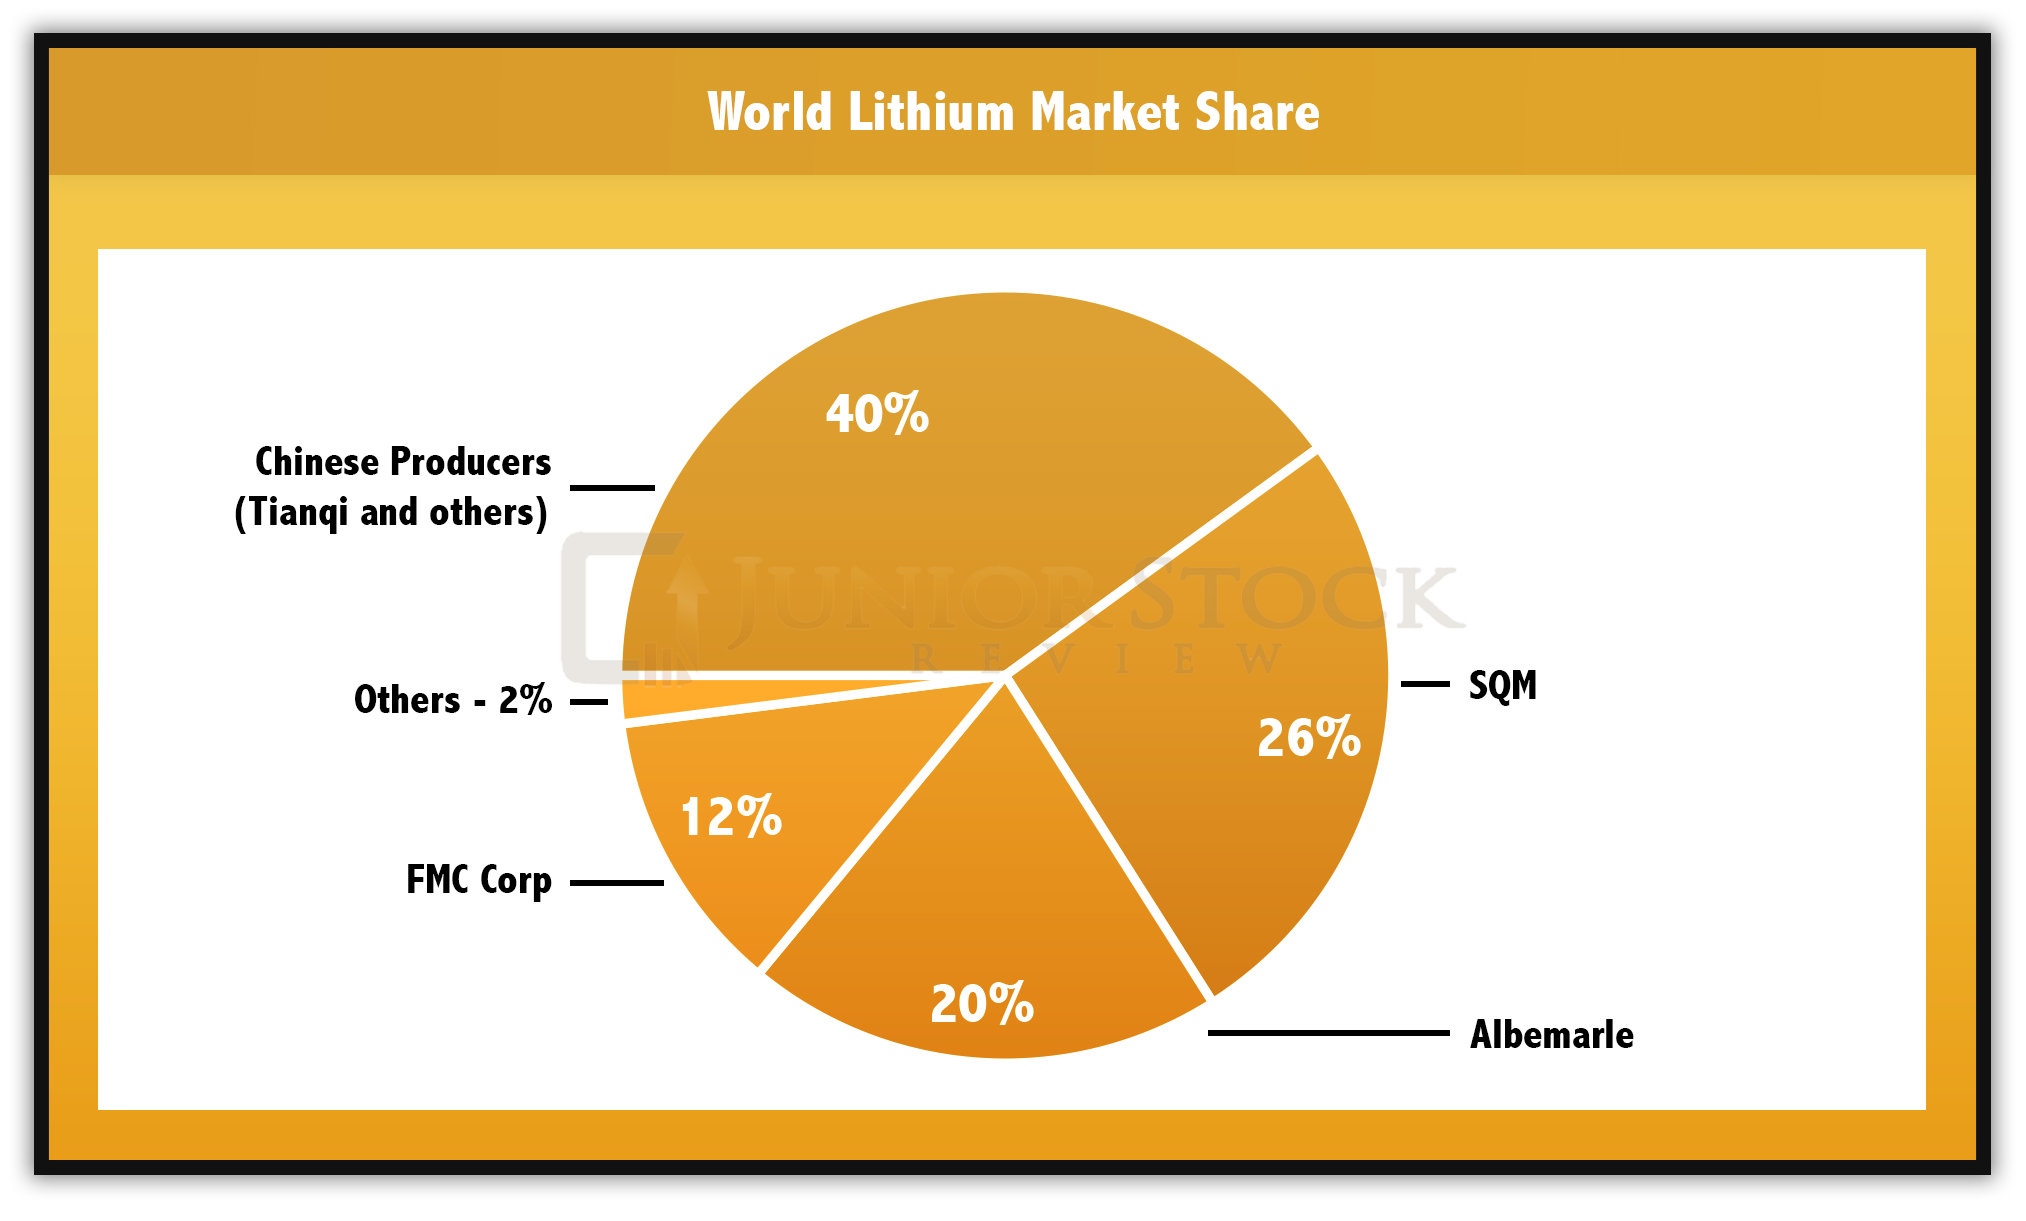
B: The lithium market is very interesting. For a metal that, I believe, is going to be in high demand over the next couple of years, it’s hard to find and put together the information for supply and demand dynamics.  The market is still very small. There are four main players. You’re talking about concentrations of production coming predominantly out of the lithium triangle in South America – that’s Chile, Argentina and Bolivia, and the main hard rock source from Australia. The rest of the world is in a race to catch up.

B: When the gigga-factory and the electrical car movement really starts to hit its stride, it will be a scramble to meet that demand. It’ll be interesting to see how this plays out.

P: It’s tough because I’ve heard Rick Rule say there are enough known reserves to satisfy demand for a long time.

B: Chris Martenson, of PeakProsperity.com, has some relevant theories that can be applied to that.  He has a line of analysis where he explains the concept of peak oil. Most people think of peak oil as “we’re going to run out of oil,” but he points out that it’s not necessarily the case.  There are massive oil reserves and even more that we have yet to find. What may end up being more important is the rate at which you can extract the oil versus the rate it’s consumed; inflow versus outflow.

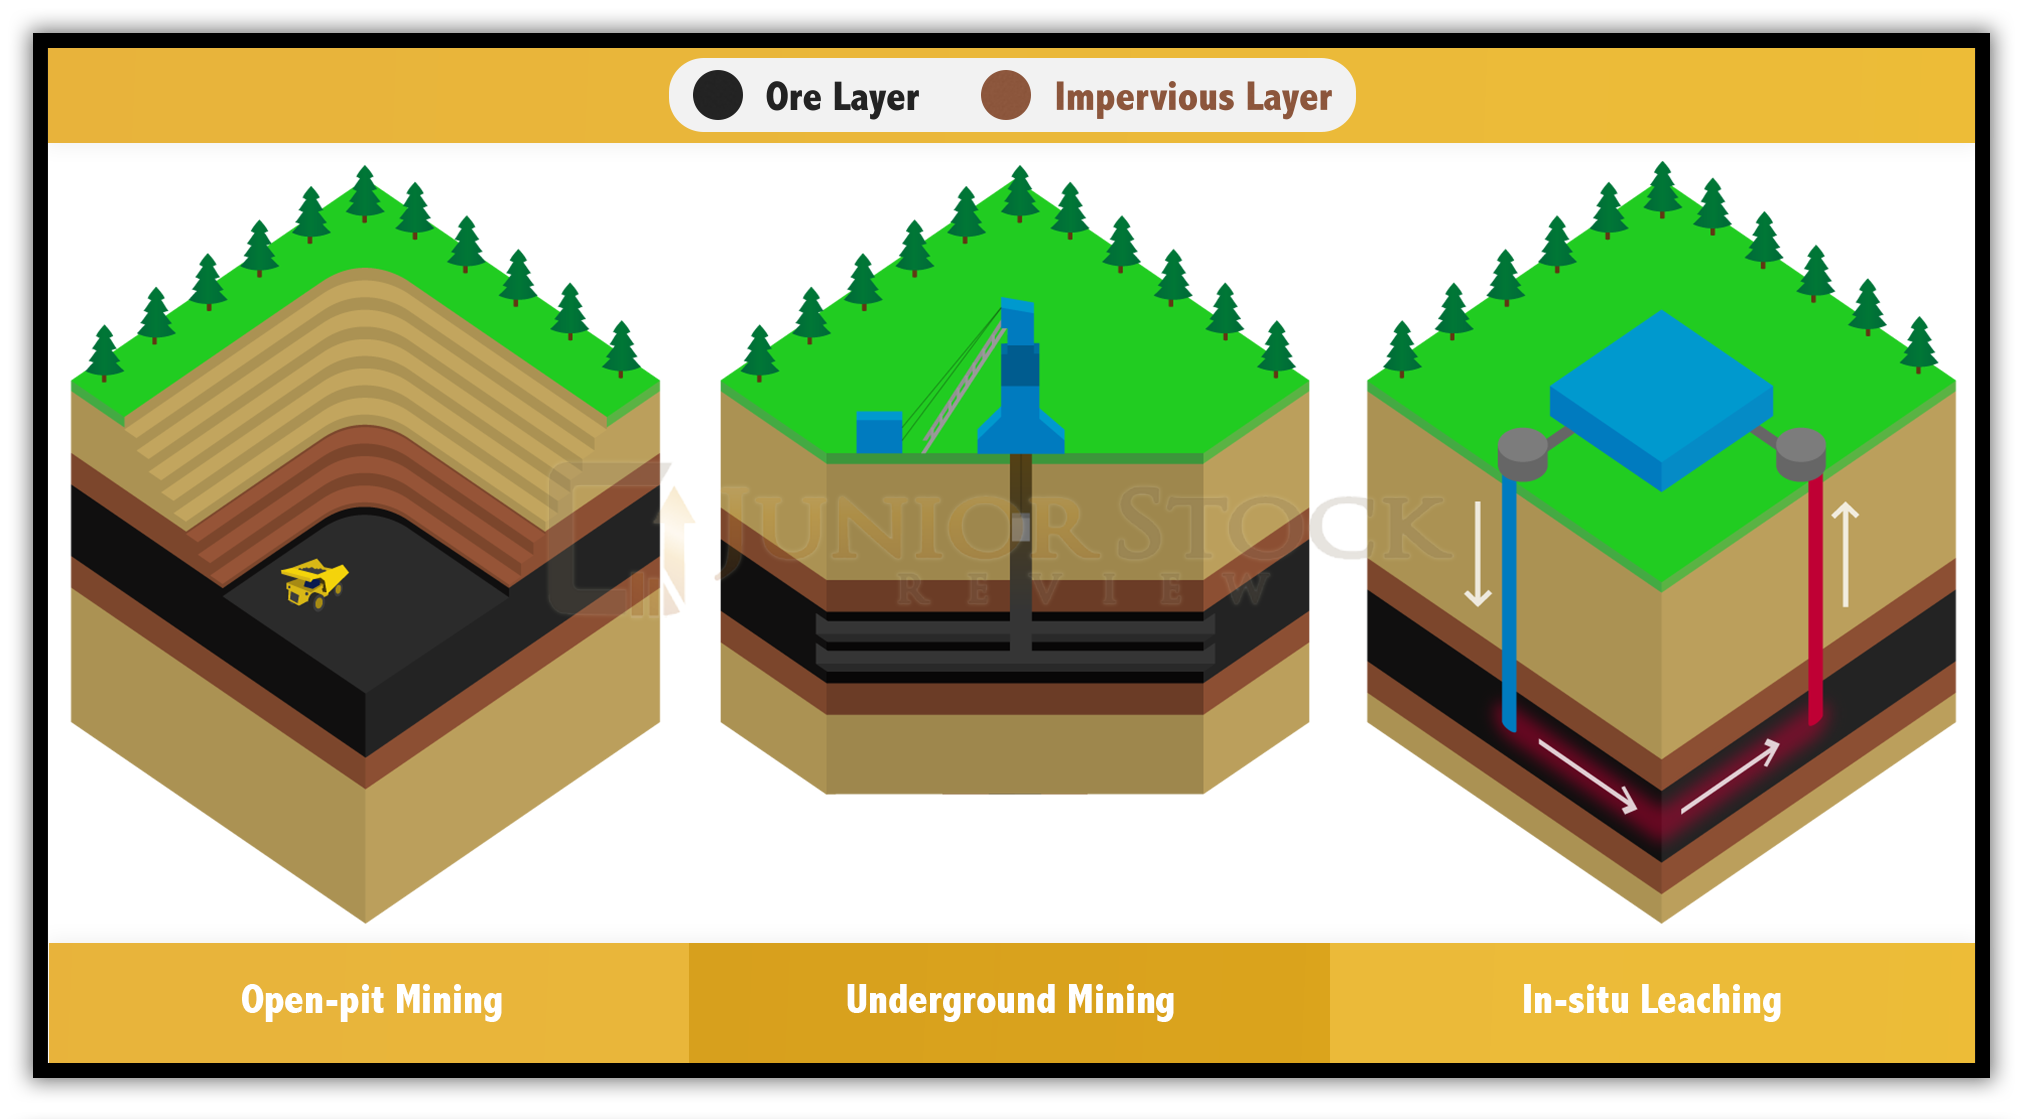
B: A similar argument could be made for lithium. While there are significant lithium reserves in the world, the rate at which they can be harvested is going to be, in my mind, the sticking point.  Simply put, there are typically technical issues with bringing these deposits to production, and especially with brines. The brine settling ponds are impacted by the weather, with evaporation being a key aspect of the refinement process. Therefore, any changes in weather patterns in the world could wreak havoc on this process, hurting production figures.

B: I don’t disagree with Rick.  There are a lot of known deposits of lithium out there, but I think it’s more complicated than just referring to the number of reserves that exist in the world.

P: Well, that’s something I haven’t heard before — the variability in the production from the brines. If we’re talking about a market with a few large sources of supply and these sources have great potential variability caused by weather, then that is a very interesting set up for tightness in the market.

B: Definitely.  The lithium triangle in South America is the premier source of cheap lithium. Politically, Argentina has changed dramatically with their new president, and South America as a whole is looking pretty good from a political risk perspective, but who knows how the Trump effect could reverberate down there.  If he decides he wants to add tariffs to certain commodities, he could add a source of instability to the lithium market.

B: Suppose something did happen to brine production in the lithium triangle. You could, conceivably, see half of the global production of lithium come offline.  That would be a serious development that could have major impacts under the current demand profile, let alone in a growth scenario.  I don’t know what is going to happen, but it is very interesting to see how all these different things could significantly affect this relatively small market.

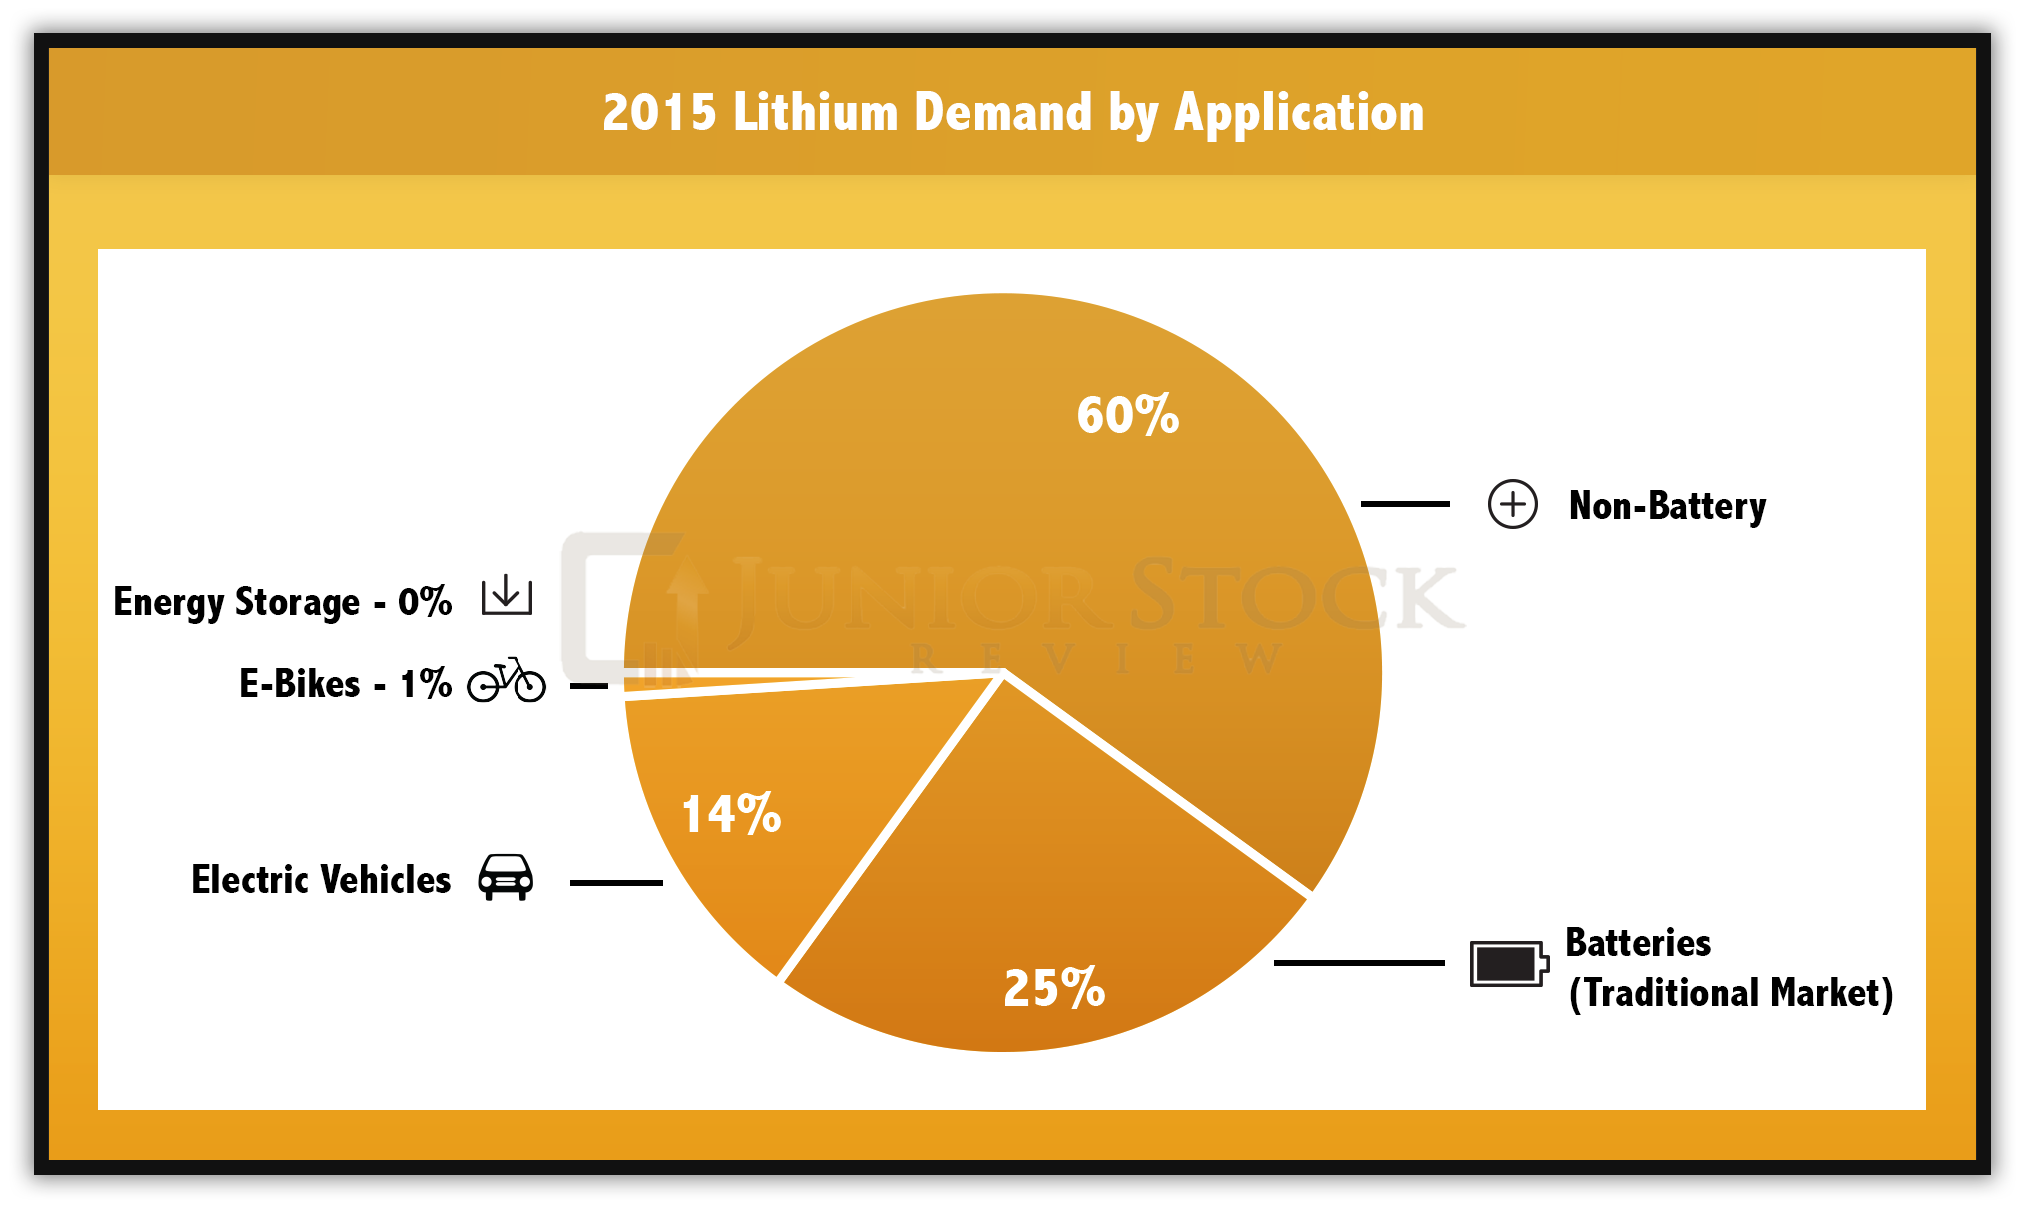
P: Right.  The growing demand profile for lithium always seems to be the thing that gets people excited.

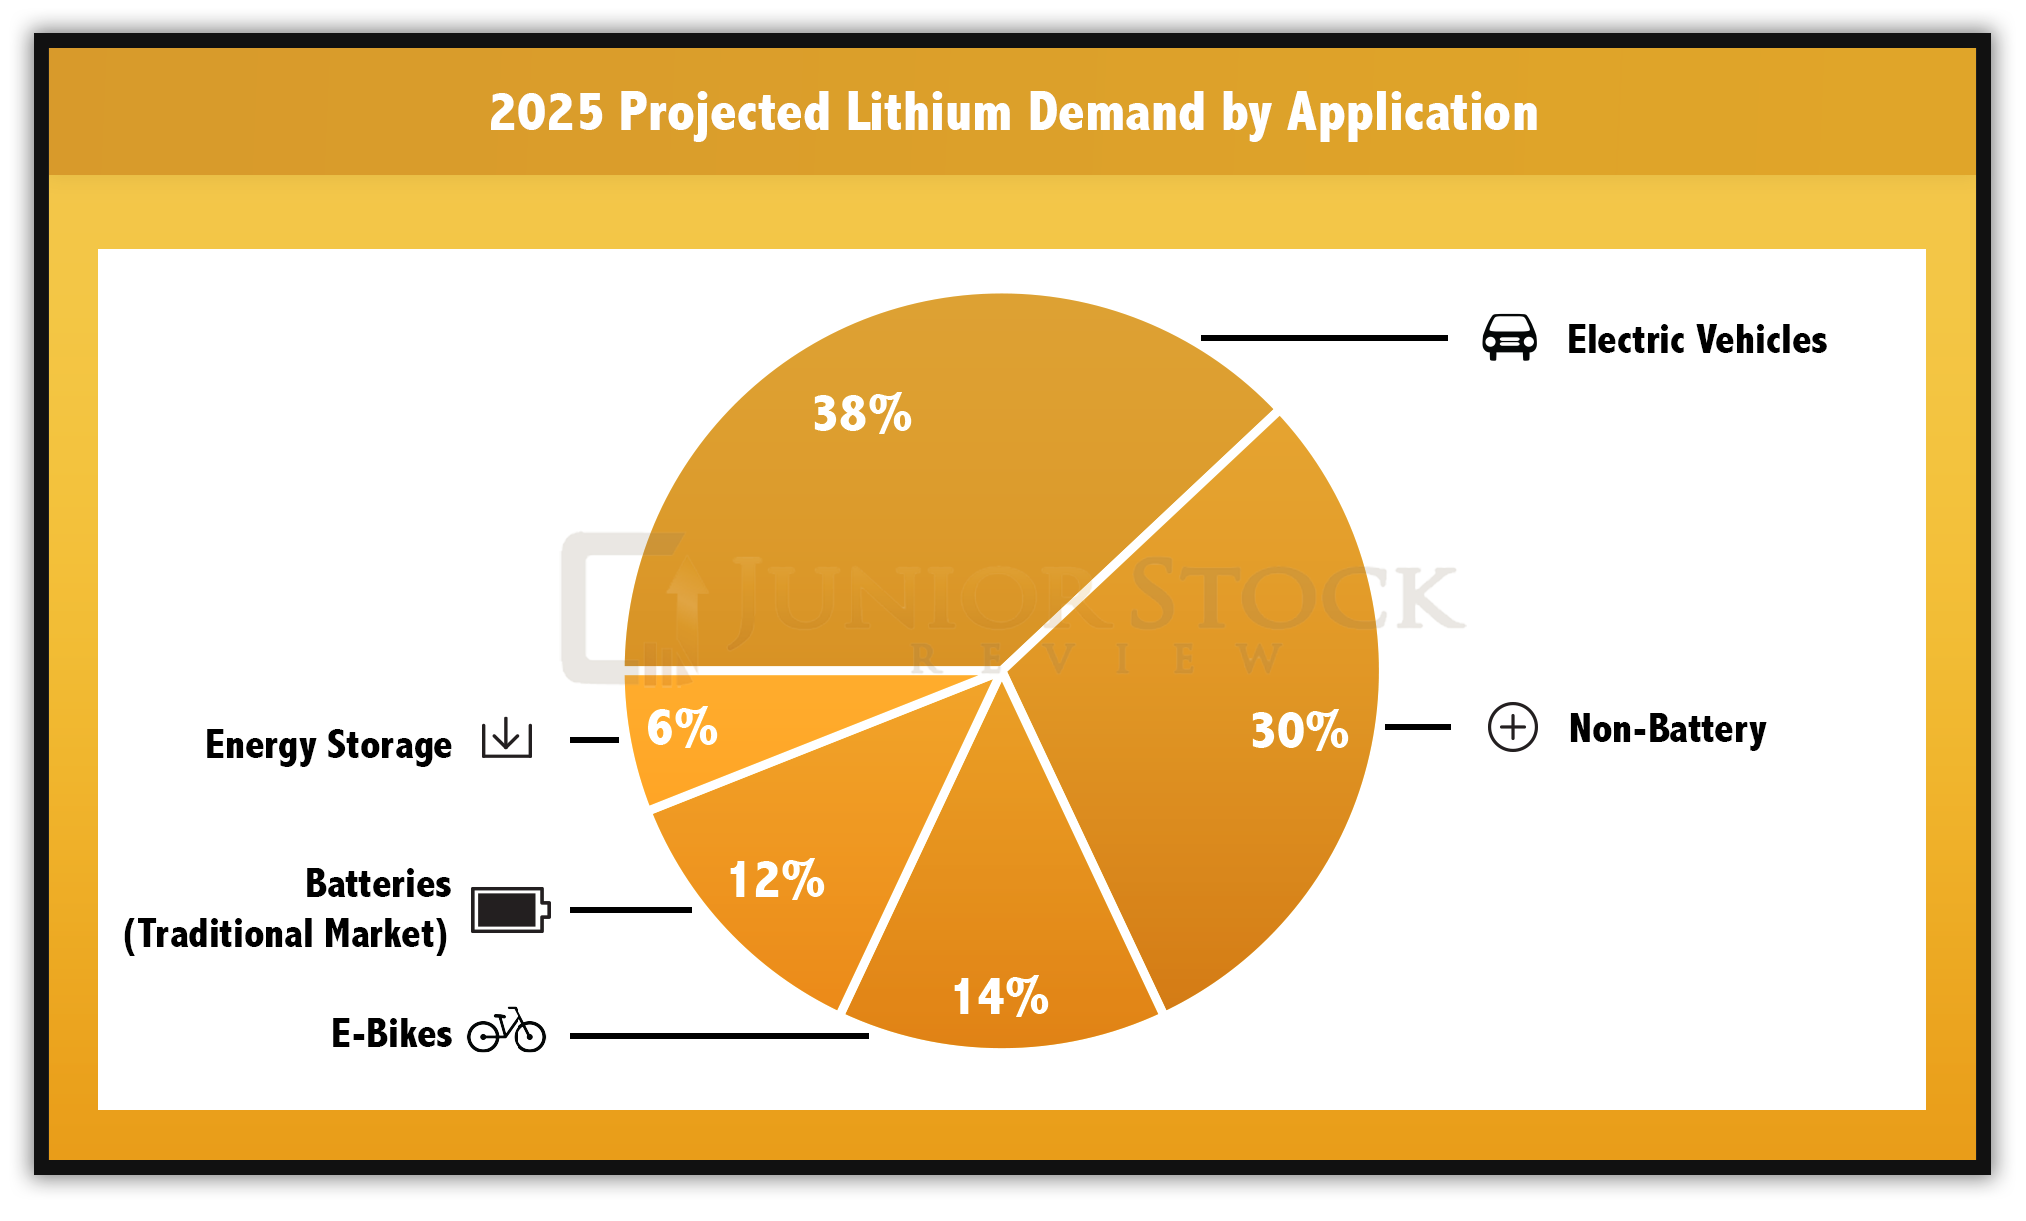
B: Yes. The Paris accord was passed last year — lots of press around that. And the International Energy Agency has something called the 450 Scenario, which calls for reductions of carbon emissions to achieve global concentrations of greenhouse gasses of 450 parts per million. They plan to do that in segments – by 2040.  For example, if the United States is to comply with the reduction of carbon emissions related to vehicles, they will have to reduce their emissions by 3%.

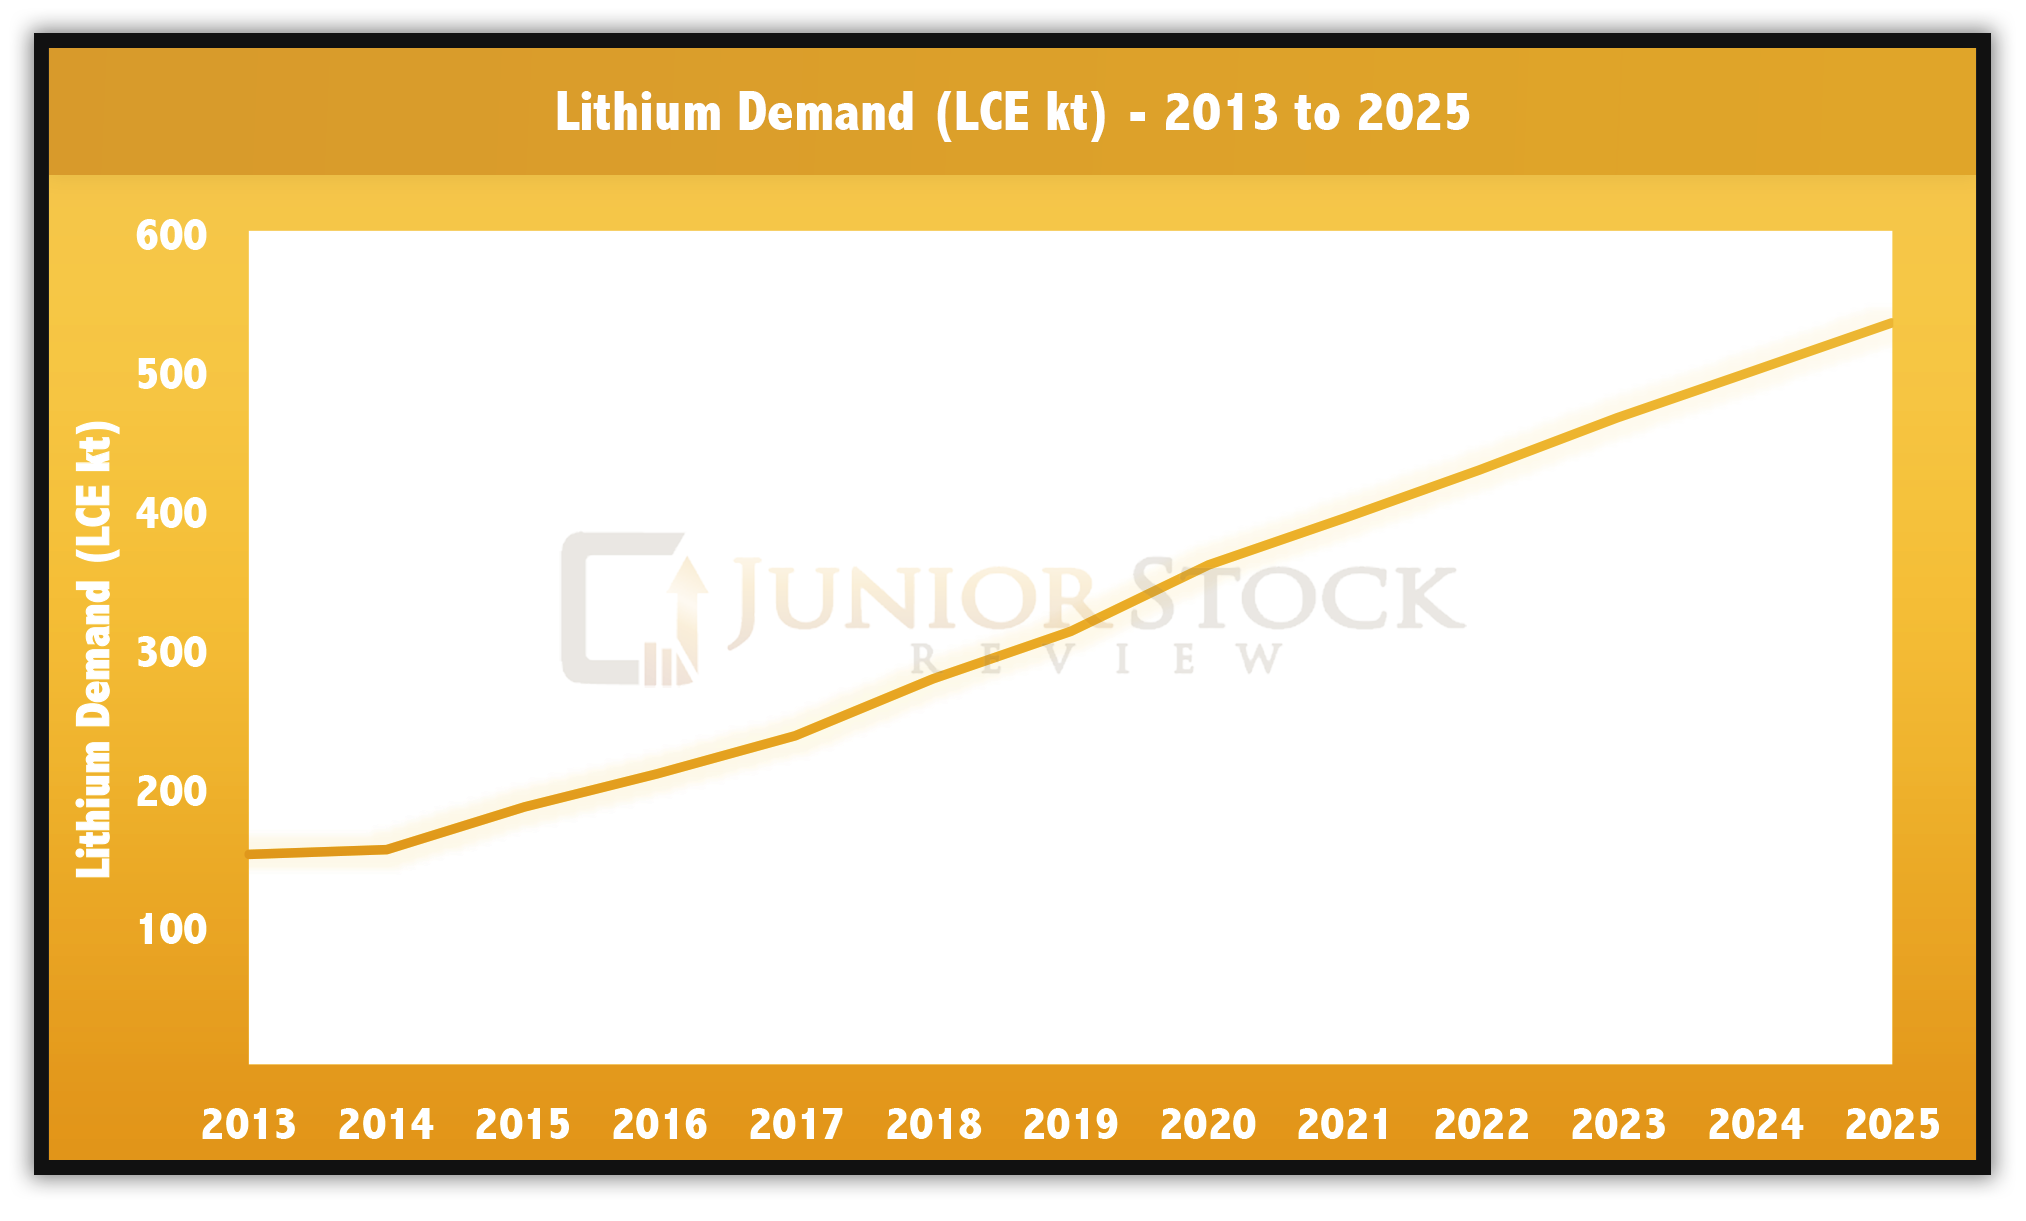
B: Deutsche Bank came out with their forecast for lithium demand, which I cited in my report.  It was a linear distribution going out to 2025. From my experience, not much in real life follows a linear path, it is typical exponential growth that dictates most behaviour. If demand increases faster than expected, it becomes about how fast you can get the lithium out of the ground to meet demand. It might not be a long-term demand squeeze, but the setup is there for at least a year of huge volatility.  The markets may be able to get it under control by bringing on other sources of supply, in line with what Rick has said, but you could have short-term fluctuations with major price swings, in my opinion.

P: Well, I am curious to learn more about the potential for declines in lithium brine production caused by weather. The bits and pieces that I’ve heard about the engineering aspects of brine production are very interesting. Any other commodities that you’d like to discuss here?

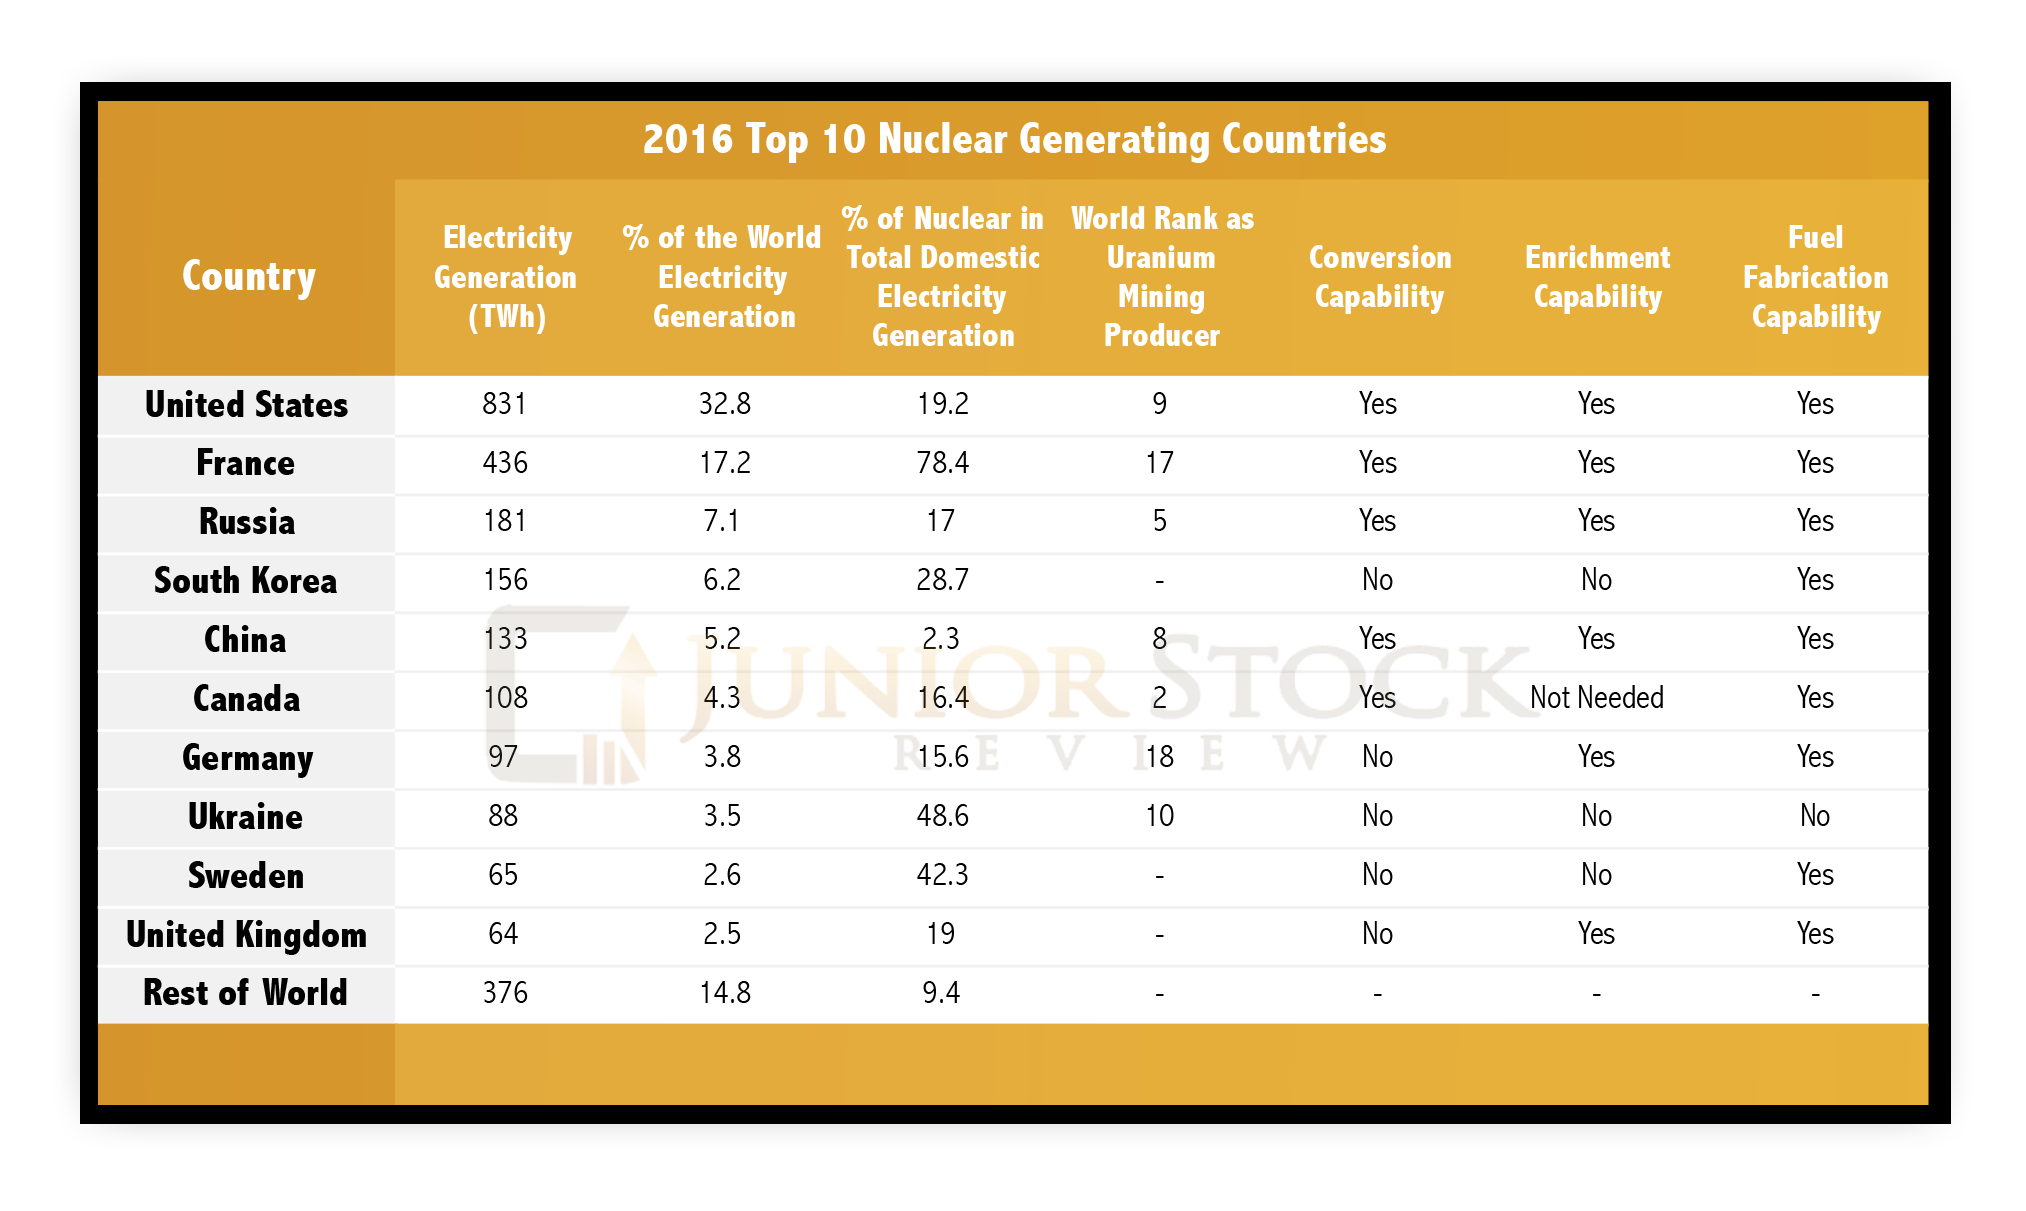
B: Despite my interest in lithium, I tend to concentrate on things that are out of favour. For the last two and a half months, I’ve written a four-part series on uranium and why I think the future is bright (Uranium Scenarios – Part 3B of 4). The more people who doubt it, the more I like it. I think it was Marin Katusa who came out a couple of weeks ago and called a bottom in uranium prices.  Time will tell if he’s right, but it is better to be early than late for this one, I think!

P: Any comments on solar and wind, broadly, as competitors for nuclear energy?

B: Yes.  I see a couple of things to discuss there. Typically, when people are talking about alternative energies like solar and wind, they’re focusing on the environmental impact. If you compare it to nuclear power, neither have any direct carbon emissions.  If you look into the construction and fabrication of solar cells and wind turbines –it all requires mining.

B: Some of the European data I’ve seen suggests that nuclear power actually has a lower carbon footprint than renewables.  You can then look at the physical footprint of the renewables.  The footprint for wind turbines can be quite large and they often take up a lot of farmland. I live in a part of Ontario where there is a lot of controversy over windmills, because people don’t want to live next to them for a number of reasons.

B: And, with solar farms, the efficiencies on the photovoltaic cells are pretty poor right now.  They need to create huge solar farms to produce enough electricity to register on the grid.  In Canada, we live north of the 49th parallel, and the amount of sun is pretty low in comparison to some of the southern States or countries across the equator.  I don’t think solar is the answer for baseload power either, at least in its current technological state.

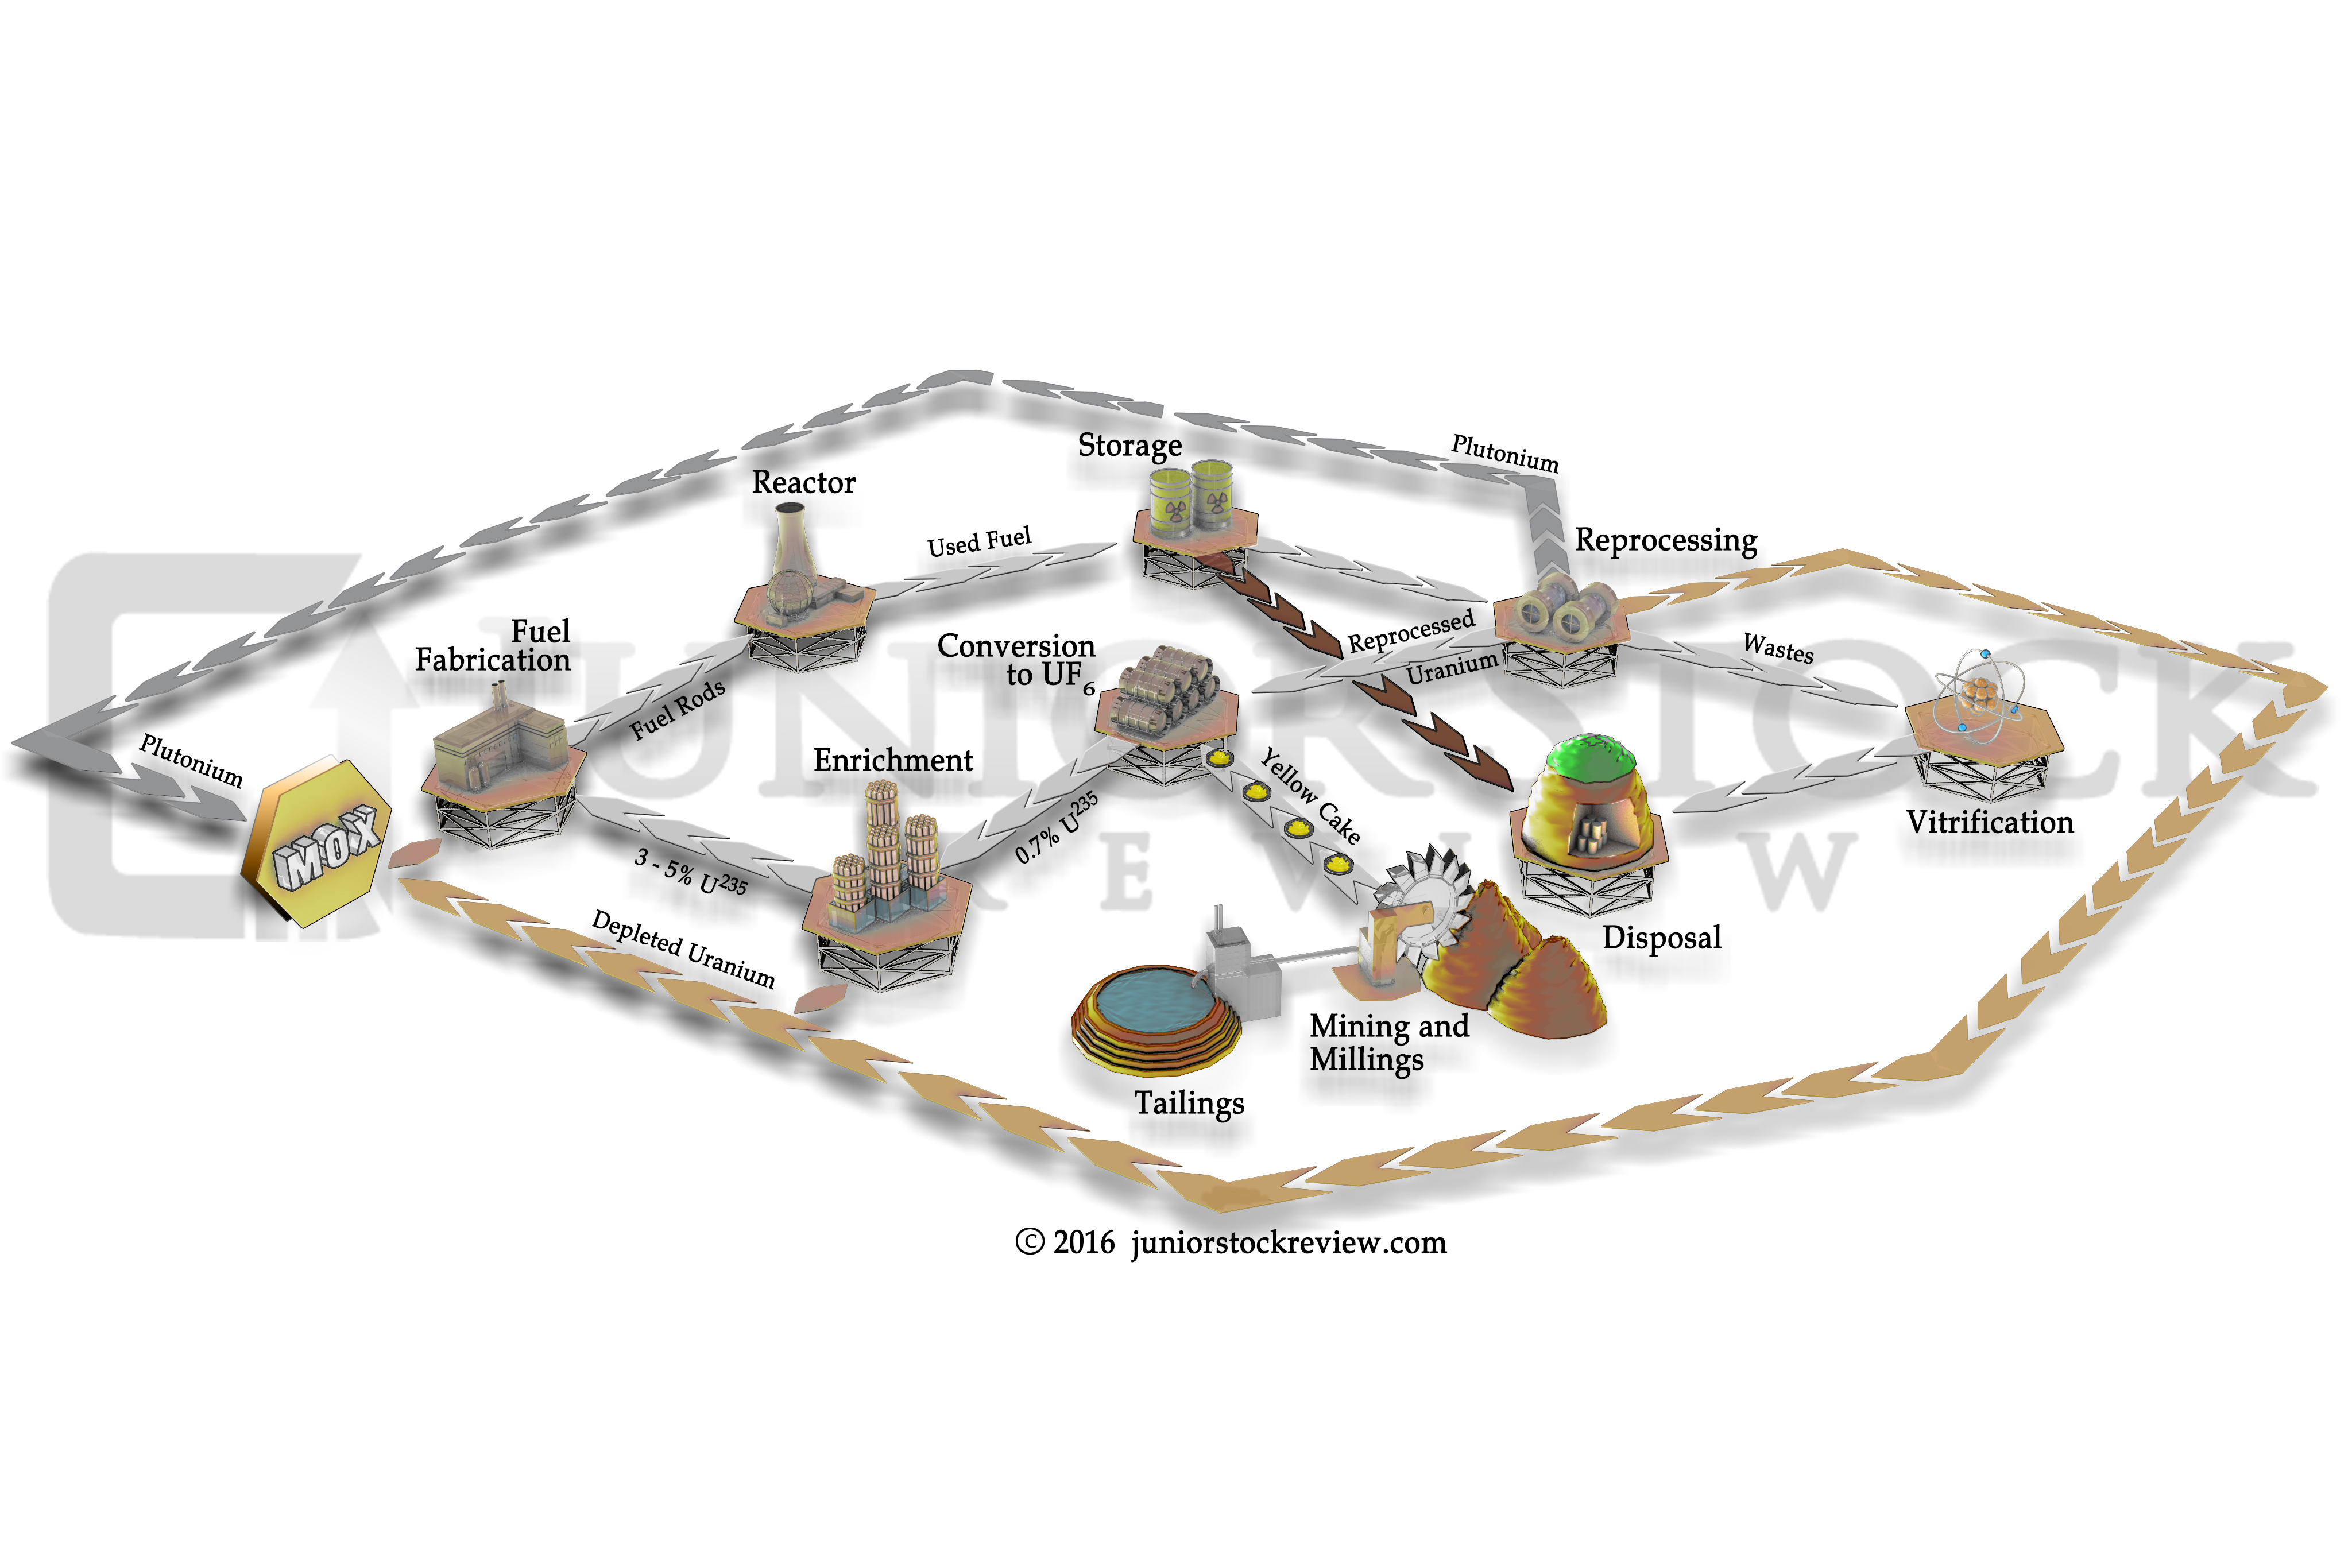
B: If people can get over the fact that there’s radioactive waste then uranium is the obvious answer.  In the long term, the uranium business will change as the industry is coming up with new types of nuclear reactors.  These new reactors are going to use what we now consider to be nuclear waste; material with well under the 3.5% U235 fissile material that’s commonly used as fuel.

P: I’ve heard troubling comments about the cost declines in solar — negative electricity prices on spot markets during mid-day in some of the deregulated markets, like California and Germany.

B: I don’t know much about that.  In Ontario, at least, there was a feed in tariff programme where the provincial government gave 20-year contracts to power producers, large and small, for fixed prices somewhere between 75c to $1 per kWh.  That is significantly above the peak rate that we pay for electricity in Ontario, which is around 10c. A lot of the market is still subsidized and somebody is paying for it in some shape or form. It would be interesting to see what the actual cost is to produce renewable energy in Ontario, all in.

P: Well, the issue of non-market actors coming in and doing things to help seems to be a big issue throughout history.  Getting in there and distorting the price signals.

B: Absolutely.

P: Commodity markets are prone to exaggeration at the best of times, I think, but add in some government assistance and that can just make things all the more complicated. Distorting the signals is a big deal — seems to me that they can cover up problems in the short term, allow them to persist, and develop into something bigger.

B That seems to be why government intervention generally doesn’t work — you can’t create these imbalances.  An example from the natural world, we tried to fix the problem with the Purple Loosestrife plant in Ontario by bringing in an African beetle to eat it.  Which, on the surface was great; they solved that problem. But, what happens with this new influx of beetles? The solutions can cause more problems and things can get out of hand quickly.  Somethings are meant to die — it’s sad, but it’s part of life. You have to let it happen.

P: And investing around that — I guess that’s why we get painted with the brush of being evil speculators sometimes.

B: That’s right!

P: To change gears a bit, does technological change that figure in prominently to your thinking and investing?  I see it there in the uranium industry, but I suspect that it may be hard to invest in that yet.

B: They’ve got these fast neutron reactors that are being tested in China and in Russia, and there’s also thorium reactors.  Thorium reactors are interesting because thorium is much more abundant in the world and the waste isn’t as much of a concern. It’s something the Chinese are really pursuing, but their dates for these things are far away — maybe 2040 or 2050.

B: My thoughts are that most of this technological change is exponential. You could plot a linear path as much as you like, but when things follow an exponential path, it could be upon us before you know it! As such, I think the next boom in uranium is going to be great and there may be another cycle to be had before we get to the next generation of technologies — I think uranium is one of those things that you take it one cycle at a time. Don’t try to get too ahead of yourself about what might happen in 20 years because so much can change by then.

P: I’ve heard a distinction made about growth markets versus dependency markets, which has been helpful for me.  Coal is, apparently, an example of a dependency market because it is still essential commodity, but there’s not a lot of new coal demand coming on stream and that doesn’t really incentivize exploration. Its not really a sexy business to be in. From that perspective, the rally in coal prices this year will undo itself by bringing forward some of the known production sources — it’s not the start of a long-term bull run in coal driven by new demand sources.  I wonder if uranium is moving in a similar direction.  I recognize there is a lot of new demand coming onIine from nuclear plants around the world, but wonder how technological change may affect that in the future.

P: Anyway, I’ve always enjoyed hearing about the thorium stuff there and always loved to hear how rare earths and thorium are often found together.  I feel like that is really futuristic stuff there — a host of next-generation metals from one source.

B: This is off topic, but some of Nikolas Tesla’s free energy theories are just incredible. Some people say that the stuff he was working on actually exists, but has been supressed because there’s no profit to be made. Who knows, but if you want to talk about revolutionary — free energy could change every aspect of our lives and society. We fight most of our wars about energy, so it’s interesting to think what could happen if energy were free.

P: That’s always been something I’ve liked about the world of junior stocks — you need a bit of optimism and hope that you could change the world for the better. It can be as simple as creating jobs in a place, or as big as new types of nuclear power.  Maybe we’re both new to it, but that ambition always appealed to me.

P: So, can we expect to see you actively writing in 2017?

B: I’m looking forward to publishing some stuff in the next couple of weeks, here. And I’ll be at the Vancouver Resource Conference and PDAC, as well.

P: Well, please post some updates to CEO.CA so we can follow along.  Thanks for the chat, Brian, I look forward to talking again with you.

B: Thanks, Peter.  My pleasure.  All the best for 2017.

Posted on

The Lithium Supply and Demand Story

Lithium Demand Graph

Why lithium? Great question. In my opinion, it’s simultaneously the simplest and most complex metal. Lithium’s ‘simplicity’ comes from the fact that it’s been used in industry for quite some time, and most of the general public know the metal in its battery form. Its complexity relates to the science behind how and why it’s presently used, but more importantly, the role lithium will play in the future.

Lithium isn’t rare, but the lithium market is definitely under developed in comparison to most other industrial commodities, leaving the space to a select few conglomerate giants and a group of junior companies. The fact is, lithium has a ton of applications, from lubricating grease and glass fabrication, to glazes for ceramics, and finally, batteries. In particular, lithium is and will continue to play an increasingly important role in the battery-powered clean air future.

Let’s take a closer look at the lithium narrative…


Lithium – Hard-Rock and Brine

Lithium is present in a number of different minerals, but for those who deal with its commercial extraction, there are really only a few that are of interest.


Pegmatites

Pegmatites are commonly found throughout the world, but lithium-rich granite pegmatites are much less common, making up less than 1%. Granite pegmatite-ore bodies are the hard-rock source of lithium. The lithium minerals that occur in granite pegmatites are spodumene, apatite, lepidolite, tourmaline and amblygonite.

Spodumene is the most commonly occurring lithium hard-rock mineral, which, once upon a time, made it the number one source of lithium metal in the world. It has since been surpassed by brines, which, for a number of reasons, have become the largest contributor to lithium production.

Pegmatite Hard-Rock Processing

Lithium hard-rock recovery can be broken down into a few key steps: crushing of the ore, concentration by froth floatation, followed by hydrometallurgy and precipitation from an aqueous solution. From here, depending on the application, the producer will typically create either lithium hydroxide or lithium carbonate, which can be sent to factories to be manufactured into its final form.

When evaluating a hard-rock lithium deposit, there are a few key things to look for:

Lithium Grade – Arguably the most important figure in any type of deposit. Typically, the higher the grade of lithium, the more economic the deposit.

By-Products – Not to be confused with ‘harmful’ impurities, by-products can help reduce the cost per ton because they have value. For lithium hard-rock deposits, tantalum, beryllium and caesium are examples of profitable by-products of the refinement process.

Impurity Levels – High concentrations of impurities (non-profitable by-products) can lead to higher refinement costs and could limit their use in end use applications, such as glass and ceramics.

Location – Poor proximity to infrastructure can make a high grade lithium mine a lot less profitable or not even economically feasible.


Brines

Lithium brine deposits are accumulations of saline groundwater that are enriched in dissolved lithium. Lithium concentrations are typically measured in parts per million (ppm), milligrams per litre (mg/L) and weight percentage.

Brine is pumped up from the ground and placed into man-made ponds, where the lithium is concentrated via evaporation. Depending on the climate and weather in the region of the brine deposit, lithium concentration can take a few months to a year. Typically, lithium concentrations range between 1 and 2%. Unlike their hard-rock cousins, these concentrations can be sent to processing plants for end use production.

All lithium brine deposits have a few common characteristics (Bradley, Munk, Jochens, Hynek, Labay. USGS – A Preliminary Deposit Model for Lithium Brines, 4).

  • Arid climates
  • Closed basin containing a playa or salar
  • Tectonically driven subsidence
  • Associated igneous or geothermal activity
  • Suitable lithium source-rocks
  • One or more aquifers
  • Sufficient time to concentrate a brine


Similarly to the list of common characteristics for brine deposits, there are a few things that are particularly important when evaluating a brine deposit:

Evaporation Rate – evaporation is dependent upon the climate in which the deposit is located. Hours of sunlight, humidity, wind levels and temperature all have an effect on the evaporation rate. A low evaporation rate could make the difference between an economic deposit and an uneconomic one.

Lithium Grade – Arguably the most important figure in any type of deposit. Typically, the higher the grade of lithium, the more economic the deposit.

By-Products – Not to be confused with ‘harmful’ impurities, by-products can help reduce the cost per ton because they have value. For lithium deposits, the primary by-product is potassium.

Location – Poor proximity to infrastructure can make a high grade lithium mine a lot less profitable or not even economically feasible.

Impurity Levels – The magnesium to lithium ratio and the sulphate to lithium ratio are very important figures to look at when examining a brine deposit, because separating these impurities from the lithium is one of the largest expenses in the brine refinement process. For both of these ratios, you’re looking for low figures.

Brines are today’s answer to lithium demand as they are more wide spread, typically larger in resource scale, and generally have lower production costs.  Countries such as Chile, Argentina and China extract the majority of their lithium production from brine deposits.


The Lithium Supply Story

Lithium Mine Production

Source: United States Geological Survey (USGS)

Lithium reserves exist on 5 continents: North America, South America, Africa, Asia and Australia. As the table shows, however, there are reserves on 5 continents but the concentration is in South America, where there’s approximately 66% of the world’s reserves.

‘The Lithium Triangle’ refers to Chile, Argentina and Bolivia. Beginning with Chile, the number 2 producer of lithium in the world and 1st in reserves, their reserves are held in brine deposits. Its main brine deposit is The Salar de Atacama, which is located in the Antofagasta region. The Salar de Atacama is approximately 3000 square kilometres and has an estimated 6.8 Mt of lithium reserves.

For reference, ‘salar’ means a salt-encrusted depression (as in the nitrate fields in Chile) that may or may not be the basin of an evaporated lake

The other key player in The Lithium Triangle is Argentina, the number 3 producer of lithium in the world and 3rd in reserves. Argentina’s source of lithium, like Chile, is found in brines. Although Bolivia currently makes up the smallest portion of The Lithium Triangle, it’s thought to have the largest undeveloped lithium brine in the world, Salar de Uyuni. USGS Mineral Commodity Summaries estimates that this prized salt flat contains 9 million tonnes of identified lithium resource.

China is the number 4 producer of lithium in the world and 2nd in reserves. China’s lithium deposits are found both in hard-rock and brine sources. Its lithium-rich pegmatite deposits are found in Jiajika, Barkam, Altai, Koktokay and the Nanping district, while its lithium-rich brines, which possess the vast majority of its reserves, are found mainly on the Quighai-Tibet plateau.

Currently, Australia is the number 1 producer of lithium in the world. Australia’s lithium is held in hard-rock deposits, mainly the Greenbushes deposit, which is currently in production. Finally, the Mount Cattlin and Mount Marion projects, which aren’t yet in production, are expected to alleviate some of the supply crunch for world demand in the future.


Lithium is primarily sold through private contracts which are controlled by 4 companies:

Lithium Market Share

Source: Sociedad Quimca Y Minera De Chile  – Corporate presentation – Slide 11


With only 4 major players in the lithium market, I have put together some quick points on each company to give you an idea of who they are, where they are, and what they do.


Sichuan Tianqi Lithium Industries  – Tianqi information taken from their website, unless otherwise cited.

  • Collectively, Chinese lithium producers have a market share of 40% (SQM – slide 11)
  • Traded on the Shenzhen Exchange (SZSE)
  • Based in China and founded in 1995. As stated on their website, “We…are a key enterprise to the Provincial Government’s initiative for the ‘Promotion and Support of Emerging Strategic Industries,’ ”
  • Tianqi offers a diverse product line, with both specialty and industrial application lithium products.


Sociedad Quimca Y Minera De Chile (SQM) – All information acquired through corporate presentation

  • Lithium market share of 26%
  • Founded in 1968 to reorganize the Chilean nitrate industry. Over time, converted from a fully Chilean State owned company to a private enterprise by 1988.
  • Ownership Structure: Pampa Group and Kona Group – 32%, Potash Corporation – 32%, Bank of New York (ADRS) – 23%, and Other – 13% .
  • SQM is involved in a number of market segments, such as specialty plant nutrition, iodine, lithium, industrial chemicals, potassium and metals exploration.
  • SQM lithium resources are held in salar brines within the Atacama Salt Desert region of Chile. Joint Venture Project in Argentina planned for production in 2019, with a 50K Mt/year capacity.
  • Traded on the New York Stock Exchange (NYSE).


Albemarle –  All Albemarle information taken from website and Corporate Investor Presentation (September 13, 2016)

  • 2015 Lithium market share of 20%.
  • Traded on the New York Stock Exchange (NYSE).
  • Headquartered in Charlotte, North Carolina, United States.
  • Albemarle Paper Manufacturing Company was founded in 1887.
  • Albemarle is involved in a number of market segments, such as refining solutions, lithium and advanced materials, bromine specialties, fine chemistry services, and Chemetall surface treatment.
  • In 2015, Albemarle acquired Rockwood Holdings, parent company for Rockwood Lithium, for USD $6.2 Billion.
  • Albemarle operates the world’s 2nd largest brine project on Salar de Atacama in Chile, with an output of 25 ktpa, and the Silver Peak brine operation in the U.S., with an output of 6 ktpa.
  • Australian Hard-Rock Resources – Greenbushes Mine (through Talison JV) – Albemarle’s share of annual capacity is 30 ktpa.

FMC Corporation  – All FMC information taken from website.

  • Lithium market share 12%.
  • Traded on the New York Stock Exchange (NYSE).
  • Established in 1883, FMC roots are in agriculture.
  • Corporate Headquarters in Philadelphia, Pennsylvania and Charlotte, North Carolina.
  • FMC is involved in a number of market segments, such as agriculture, health and nutrition and lithium.
  • 79% of FMC’s lithium revenue is derived from the sale of lithium specialty products, such as lithium hydroxide, butyllithium, and high purity metal.


Technological Affects on Lithium Supply

A major impact to the lithium supply story could come from a technological breakthrough in the refinement of lithium brines. Current research and development dollars spent by South Korean giant, POSCO, and privately owned, Energi Corporation, are exploring methods of refining lithium brine without the use of evaporation.  The current major cost in the brine refinement process is the removal of impurities such as magnesium, calcium, iron and potassium via evaporation and additives.  If they are successful, it will revolutionize the lithium mining industry, as more deposits will become economical and existing mining operations could change production methods to capitalize on cheaper processing costs. When or if this occurs, is a big question.

That said, the fact that R&D dollars are being spent in lithium refinement is a major plus, in my books. With this much interest, I think you can almost guarantee a strong future for lithium, worldwide.


Lithium Demand

Currently, lithium’s demand is rooted in the following applications (in no particular order):

Lubricant Grease – An estimated 2.38 billion pound market, in which lithium-based greases make up 75%. Lithium-based greases generally have good stability, high temperature characteristics and water-resistance properties.

Glass – Lithium typically sourced from the mineral spodumene reduces the viscosity and thermal expansion of glass and, therefore, leads to increased melting efficiencies and/or larger effective furnace capacities. The end result is a substantial energy savings for the glass manufacturers.

Ceramics – Lithium is used in the ceramics industry to produce glazes. The glazes improve a ceramic piece’s shock absorption and stain resistance, protecting the piece against damage. Lithium carbonate is typically used for this application.

Health Products – Lithium, in small amounts (around 0.170 mg/L), is prescribed to those with bipolar disorders or individuals with depression who don’t respond to anti-depressants.

Batteries – Batteries are possibly the best known lithium application of all. It’s where the future lays for lithium demand. This will be explained further in the next section.


Batteries

Why is lithium used in batteries? Simply, with current technology, lithium provides the best combination of energy density (weight to power ratio) and price.

Batteries have essentially three main components: cathode, anode and electrolyte. When the cathode and anode are connected via a wire, for example, electrons flow from the anode through the wire to the cathode, creating an electrical current.

Currently, there are an estimated 80 different lithium-ion battery chemistries in production, with these varying chemistries all exhibiting different characteristics, such as capacity and voltage. Lithium is typically found in the cathode of the battery, commonly in the form of lithium cobalt oxide, while the electrolyte is commonly in the form of a lithium salt, such as LiPF6, LiBF4 or LiCLO4. The anode material is commonly carbon-based, with graphite being the most popular.

Overall, a lithium ion battery’s output is around 3.6 volts, which is more than twice as much as its alkaline cousin.


What does the current lithium demand by application look like?

2015 Lithium Demand by Application

Source: Deutsche Bank Markets Research – Lithium 101 – pg.23

Projected demand for 2025 is much different, not only in overall demand tonnage, but the percentages each application encompasses. The future is expected to be bright for batteries in the non-traditional markets; electric cars, e-bikes, and energy storage.

2025 Lithium Demand by Application

Source: Deutsche Bank Markets Research – Lithium 101 – pg.23


Lithium Present and Future Market Demand

Lithium Demand Graph

Source: Deutsche Bank Markets Research – Lithium 101 – pg.23

The interesting thing about this projected demand curve is that it is linear. The reason I think that’s interesting is that most things in life don’t follow a linear path, especially those things that are rapidly changing, such as the lithium market. Now, the opposite could be true, the demand could be flat or declining in the future, but I tend to think that the future for lithium will be exponential.

For those who don’t know what an exponential function looks like, think of a hockey stick turned upwards with the blade in the air. Basically, it looks linear for a while, constant growth, and then boom – to the moon it goes.

Why do I think this? Mainly because of the politicized nature of green energy. Whether it’s the 450 Scenario or some other push to reduce carbon emissions, governments across the world are allocating more and more policy and CASH to the cause. The final inflection point could be massive and it could happen before 2025, in my opinion.


Emissions Perspective

The 450 Scenario calls for long-term concentrations of local greenhouse gases to be at 450 ppm CO2 equivalent by 2040. To put that into perspective, we globally emitted 32,381 Mt of CO2 in 2014 (International Energy Agency, 2016 Key World Energy Statistics, 45). Under the 450 Scenario, that number reduces dramatically to 18,777 Mt of CO2.

Using the United States as an example,  Statista states that there were around 260 million registered vehicles in the United States in 2014. The U.S. Energy Information Administration (EIA) estimates that U.S. fossil fuel consumption for transportation in 2015 resulted in a combined 1,545 million tonnes of CO2, which is 29% of the total CO2 emissions by the country.

Emissions per vehicle = 1,545,000,000 / 260,000,000 = 6 tonnes/vehicle

Therefore, my estimated carbon emissions per U.S. vehicle is around 6 tonnes per year. If the United States figures to comply with the goals of the 450 Scenario, to drop transportation emissions to 26%, in-line with the rest of the world, they will need a reduction of 3% (29% to 26%) (International Energy Agency, 2016 Key World Energy Statistics, 46). The following calculation shows that a reduction of this magnitude would affect approximately 7.7 million vehicles.

3% of 1,545,000,000 = 46,350,000 tonnes of CO2

46,350,000t / 6 t/vehicle = 7,725,000 vehicles

NOTE: This calculation should not be taken as exact, there are assumptions that have been made. The calculation is only to gain some perspective on the potential impact of the 450 Scenario.

Insideevs.com reports that there were 116,099 full electric vehicles sold in the United States in 2015, and 441,179 worldwide. If you linearly distribute the number of vehicles affected by the 450 Scenario on a 23-year time horizon (2017 to 2040), 7,725,000 / 23 = 335,870 vehicles per year would need to be sold, or almost 3 times the number of current sales per year.

This is provided that car demand in the United States stays where it is. If there is growth in the number of people who want to drive, this electric vehicle number would need to increase.

How does this equate to lithium demand? Well, it isn’t an easy calculation as there are a lot of assumptions, but I did find an estimate of 47 lbs (0.021 t) of lithium per Tesla Model S (sedan). If 335,870 Tesla Model S were sold in the United States in a given year, this would translate into 335,870 x 0.021 t of 7,053 t of lithium, or 37,544 t of lithium carbonate (conversion from Li to LiCO3 – 1 : 5.323)


To summarize this example:

  • Calculation only represents a 3% decrease in American transportation carbon emissions.
  • A 3% improvement in emissions will affect the equivalent of 7.7 million vehicles.
  • If these 7.7 million vehicles were replaced by fully electric vehicles over the next 23 years (450 scenario deadline is 2040), that would equate to 335,870 cars sold each year. In my opinion, it is highly unlikely that it will be linearly distributed.
  • Using 2015 data from insideevs.com, world demand is roughly 4 times that of the United States, thus, if the world kept pace, it would equal around 1.3 million vehicles per year.
  • In terms of lithium carbonate, 1.3 million electric vehicles could mean 150,176 t in worldwide demand.

I believe this 3% improvement scenario for vehicles per year is conservative. In reality, I think demand in the next 5 years could easily be twice as much. Deutsche Bank believes demand will hit 2.4 million in global electric vehicles sold in 2025. They estimate total demand in terms of lithium carbonate equivalent to be 534 kt, of which batteries would make up 45% (Deutsche Bank, Lithium 101 Report, 24).

The following table gives you a quick conversion factor for some common lithium compounds.

Lithium Volume Conversion Table

Source: London Stock Exchange   

FYI – A quick example: If you’re given a resource in terms of %Spodumene, 5%, and you want to convert it to %Lithium, simply multiply the 5% by the lithium conversion factor 0.038, which equals 0.19%.


I believe it’s undeniable that lithium will play a major role in powering our clean air future. The trend is your friend and in this case it is only the beginning of what appears to be a major turning point in the way we live our day to day lives.


Until next time,


Brian


Disclaimer: This is not an investment recommendation, it is an investment idea. I am not an investment professional and do not know your specific investment criteria. Please do your own due diligence. I have not been paid to write this article, nor do I own any of the companies listed in this report.

Posted on

North American Uranium Producers

Uranium Mining Techniques

This is a ‘For Your Information (FYI)’ style report on North American uranium producers. I’ve given a very brief overview of each company, where their assets are, the size of their resource, and a few other tidbits.  If you haven’t already, check out the in-depth articles I’ve recently written on Cameco and Energy Fuels, as well.

North American Uranium Producers

NOTE: The table above reflects MCAP and resource numbers taken at the time of the writing of the report and doesn’t necessarily reflect the current MCAP or resource numbers of the companies mentioned. Please do your own due diligence to get updated values.


Cameco – Link to the Report

Energy Fuels – Link to the Report


Denison Mines

Denison Mines is led by CEO, David Cates, who is an accountant (CPA, CA) by trade. Cates has worked in the resource sector for a number of years, previously working with Kinross and PwC LLP before joining Denison in 2008.

While Denison Mines is better known for its uranium development project, Wheeler River, it does own 22.5% part of the McClean Lake Mill. The mill processes uranium ore produced by Cameco’s McArthur River, up to 18 Mlbs/yr U3O8. The remaining 6 Mlbs/year in excess capacity has been incorporated into Denison’s PEA for Wheeler River.

The mill cash generation isn’t spectacular, but does give Denison a revenue stream regardless of the uranium price.

  • Traded on the DML:TSX, DNN:NYSE
  • Executive Chairman – Lukas Lundin
  • All properties are in Canada
  • 25% ownership of GoviEx Uranium (GXU:TSXV)
    • Sold its African uranium assets to GoviEx in exchange for ownership stake
    • GoviEx Uranium is a uranium development stage company with two permitted projects, Madaouela (Niger) and Mutanga (Zambia) – this is a bigger deal than you may think – check out my article written earlier this year.
    • Total M&I resources – 124.29 Mlbs U3O8 and Inferred resources – 73.11 Mlbs U3O8


UR-Energy

UR-Energy is led by Executive Director and Acting CEO, Jeffery Klenda. Klenda’s background is in finance, having been an officer and/or director for numerous publicly traded companies throughout his 30-year career.

UR-Energy has a hedged sales book that stretches out to 2021 (See December 2016 Corporate Presentation), meaning a percentage of its current U3O8 sales are contracted at a higher than spot uranium price and, thus, is currently producing from its main asset, Lost Creek ISR Uranium Facility.

  • Traded on the NYSE: URG and the TSE: URE
  • All properties are located in the United States:
  • Lost Creek ISR Uranium Facility (6 individual contiguous projects)
    • Facility is located in Wyoming
    • M&I Resource of 13.251 million lbs U3O8 and Inferred Resource of 6.439 million lbs (Source)
    • Newly added pounds of uranium have the potential to be pipelined to the processing facility, giving the Lost Creek property a scalability factor
  • Shirley Basin Mine Site
    • Located in Wyoming
    • Purchased from AREVA in 2013
    • Preliminary Economic Assessment was completed in Q1 2015 and a mining permit application filed in 4Q 2015.
    • Estimated total of 6.3 million lbs of U3O8 may be produced from the project
  • Lost Soldier Project
    • Located in Wyoming
    • Exploration property located 14 miles north of the Lost Creek Facility
    • Requires more funding for further exploration and development. Not a priority given the current market
  • Lucky Mc Mine Site
    • Located in Wyoming
    • Part of the Pathfinder acquisition in 2013
    • Exploration property, with past production from the 1960s through to the 1990s. Historical conventional mine production of more than 46.7 million lbs.


Uranium Resources

Uranium Resources is led by CEO, Christopher Jones, who has been in the mining industry for 30 years. Currently, Jones leads a business which has recently branched out from its core business in uranium and entered the lithium exploration business. Uranium Resources refers to this as their “energy metals strategy,” which is meant to capitalize on the near and the longer term. (Source – slide 10)

Uranium Resources producing uranium assets are currently on standby until there is a sustained improvement in the uranium market.  Their Turkish Temrezli property is by far their largest uranium project and is currently in the permitting stage of development.

NOTE: With its listing on the ASX, Uranium Resources is listed according to JORC standards, which are different than NI 43-101.

  • Traded on the Nasdaq: URRE and ASX: URI
  • Uranium Properties are located in the United States and Turkey:
  • Temrezli Uranium Project
    • Located in Turkey
    • 44,700 acres of prospective property
    • M&I and Inferred Resource Total of 13.3 million lbs U3O8
    • Pre-Feasibility study completed in 2015 (see presentation for further detail)
    • Permitting is underway
  • Kingsville Dome Processing Facility
    • Located in Texas, United States
    • 17,000 acres of prospective ISR projects
    • In-Place Reserves – 50,000 lbs (not NI 43-101 compliant)
    • Production suspended until “there is a sustained improvement in the uranium market” ~Uranium Resources
  • Rosita
    • Located in Texas, United States
    • In-Place Reserves – 624,000 lbs (not NI 43-101 compliant)
    • Like Kingsville, production has been suspended
  • New Mexico Projects
    • Located in New Mexico, United States
    • 190,000 acres of prospective property


  • Lithium Properties
    • Columbus Basin (Nina) Lithium Project
      • Located in Nevada
      • 2017 Outlook: Geophysical sampling, geological analysis and follow-up drilling
    • Sal Rica Lithium Project
      • Located in Utah
      • 2017 Outlook: Sampling, geophysics and target prioritization for drilling


Uranium Energy Corporation (UEC)

UEC is led by Amir Andani, who is also the CEO of the precious metals company, Brazil Resources. Andani has used the bear market in uranium to purchase uranium properties throughout the western United States and Paraguay.

Currently, UEC has one producing asset, Palangana, and its Hobson Processing Facility. Its other two main assets are Bruke Hollow, which is in the process of being permitted, and Goliad, which is permitted and under construction.

Andani is a premier marketer and presents UEC fantastically with their website and investor material. This type of promotion is an X-factor in the junior market and definitely sets Andani apart from his competitors, regardless of how you view the rest of the company.

  • Traded on the NYSE: UEC
  • Properties in the United States and Paraguay:
  • Hobson Processing Facility
    • Fully licensed and permitted
    • Operational
    • 2 million lbs of processing capacity per year
  • Palangana
    • Fully permitted and producing
    • Located in Texas
    • M&I resource – 1,057,00 lbs U3O8 and Inferred resource – 1,154,000 lbs U3O8
  • Burke Hollow
    • In development – permitting underway
    • Inferred resource – 5,121,853.25 lbs U3O8
  • Goliad 
    • Fully permitted and under construction
    • M&I resource – 5,475,200 lbs U3O8 and Inferred resource – 1,547,500 lbs U3O8
  • Exploration Projects:
    • Nichols (Texas)
    • Longhorn (Texas)
    • Salvo (Texas)
    • Dalton Pass (New Mexico)
    • Long Park (Colorado)
    • Slick Rock (Colorado)
    • Anderson (Arizona)
    • Los Cuatros (Arizona)
    • Workman (Arizona)
  • Oviedo
    • Exploration project in Paraguay
  • Yuty
    • Exploration project In Paraguay


Peninsula Energy Limited

Peninsula Energy is led by CEO, John Simpson. Simpson has over 25 years of experience in the management of listed mineral companies. Simpson is at the helm of a company which operates a producing uranium mine, the Lance ISR Mine in the United States, a uranium exploration property in South Africa, and a gold exploration property in Fiji.

Peninsula is unique because it boasts a hedged contract sales book that stretches 10 years and 8.1 million pounds (Mlbs) which, at maximum capacity for their processing plant, is almost 4 years of full production. With an average contracted selling price of $55 USD/pound for the 8.1 Mlbs, investors are given  a lot of risk mitigation to a sliding uranium price. However, this could also mean a loss of upside potential, depending on where you think the uranium price may go in the future.

Peninsula is traded on the ASX and, therefore, expresses all of their resources according to JORC code.

  • Traded on the ASX: PEN
  • Properties located in the United States, South Africa and Fiji (Gold Project)
  • Resources are listed by JORC Code (not NI 43-101)
    • Lance ISR Uranium Project 
      • Located in Wyoming, United States
      • Three deposits totalling 53,674,224 lbs U3O8 (JORC code resources): Ross -Measured & Indicated (M&I) and Inferred total 11,184,612 lbs U3O8, Kendrick – M&I and I total 29,617,020lbs U3O8, and Barber – M&I and Inferred total of 12,872,592 lbs U3O8
      • Fully permitted and producing
      • Exploration potential on the property
      • Production levels to follow their hedged sales book, with 400,000 lbs to be delivered in 2017 at approximately $55 USD per pound.
      • Currently, Peninsula has 8.1 million pounds of U3O8 under contract to deliver to major utilities in the United States and Europe over the next 10 years. These 5 contracts total approximately $44o million USD and an average 3O8 selling price of $55 USD per pound
      • Project is expected to produce 2,300,000 lbs U3O8 per annum at full capacity


  • Karoo Project (Joint Venture with BEE Groups)
    • Located in South Africa
    • Exploration property
    • JORC Code-Compliant Mineral Estimate (Indicated and Inferred) total of 56.9 million lbs of eU3O8
    • In the next 3 to 5 years, the company plans to expand this resource further, focusing drilling on the eastern sector, RystKuil channel.
  • Raki Raki Gold Project (JV – 50% ownership)
    • Located in Fiji
    • Exploration property


Anfield Resources Inc.

Anfield is led by CEO, Corey Dias, whose 10 years of experience prior to Anfield was in capital markets on both the buy and sell sides. Dias is leading this uranium development company to “near term” production; I use quotations because they still need to refurbish their conventional mill and acquire the proper mining licensing and permitting – ‘near term’ is subjective.

Conventional uranium mills are hard to come by in North America, therefore, owning one can be an asset, as the conventional mining of uranium is not complete with milling.  Anfield has used the uranium bear to acquire a variety of properties across the western United States which have past production and historical uranium resources.

  • Traded on the TSX Venture: ARY, Frankfurt: OAD
  • Steps to production: Well field development, mill refurbishment, and mine licensing/permitting
  • Potential uranium production across all assets – 1,500,000 lbs U3O8 per year
  • Properties located in the United States
    • Shootaring Canyon Mill
      • 750 tpd conventional uranium mill
      • Located in Utah
    • Velvet-Wood Mine
      • Located in Utah
      • M&I resource of 4.6 Mlbs U3O8 (Slide 10 )
      • Surface stockpile of 370,000 lbs U3O8
      • PEA completed in 2016
    • Exploration Properties (some properties have historical resources and past production)
      • Arizona – Brecca Pipes and Date Creek Basin
      • Colorado – Slick Rock District, Western Gypsum Valley District, Paradox District and Gateway District
      • Utah – Lisbon Valley, Henry Mountains Area, Moab Uranium District, Dry Valley Area, Paradox Area, Monticello-Cottonwood, Monticello-Motezuma Canyon, Thompson District, Green River District, White Canyon and San Rafael District
      • Wyoming – Black Hills, Great Divide Basin, Laramie Basin, Powder River Basin, Shirley Basin and Wind River Basin


AREVA

  • Directly or indirectly is 85.6% controlled by the French State
  • Not just a miner, they are involved in each aspect of the nuclear fuel cycle


Uranium One – Owned by AMRZ – Mining Arm of ROSATOM State Atomic Energy Corp.

  • State owned and controlled
  • Operations in the United States and Kazakhstan
    • Willow Creek ISR located in Wyoming with Proven and Probable (P&P) Reserves of 6,754,000 lbs U3O8, M&I of 16,798,000 lbs U3O8 and Inferred of 141,000,000 lbs of U3O8
    • Kazakhstan Properties (5 properties) have a total resource (M&I + Inferred) of 148,460 tU


If you believe the future is bright for uranium, but aren’t sure when the market is going to turn for the better, a producer is a great way to ride the bear market out, while having exposure to a sector that, in my opinion, could change on a dime. Each of the companies listed have merits for investment. Be objectively critical and find the company or companies that fit your personal investment criteria.


Until next time,


Brian


DISCLAIMER: The following is not an investment recommendation, it is an investment idea. I have not been compensated to write this article, however, I do own shares of one or more of the companies mentioned in this article. Please perform your own due diligence to decide whether it is a company that’s best suited for your personal investment criteria. All analytics were taken from the company websites and press releases.


Posted on

Energy Fuels: Positioned to Lead the American Uranium Renaissance

Energy Fuels

The current uranium market has, in my opinion, all the makings of the perfect contrarian investment.

  • The uranium price hit a 12-year low of $17.75 USD per lbs in these past weeks, which is close to 90% off the 2007 high – the cure for low prices is low prices.
  • The world’s electricity output has grown steadily at an average rate of 3.4% CAGR, from 2009 to 2014, in the face of turmoil following the world economic crisis that struck in the fall of 2008. (Rate calculated using data from International Energy Agency (IEA))
  •  The clean air trend has greater momentum every year, with the Paris Climate Accord, or the 450 Scenario (International Energy Agency), leading the charge to reduce carbon emissions.
  • Nuclear power generation is cheap, safe and reliable.

The uranium market is not without it detractors, but to me, it’s not if but when will the uranium market turn. The further the uranium price falls, the  further uranium companies’ share prices drop and, thus, the less risk associated with buying them.

In the famous words of Howard Marks,

“Upshot is simple: to achieve superior investment results, you have to hold non-consensus views regarding value, and they have to be accurate. That’s not easy.”
~Marks, The Most Important Thing Illuminated, pg.7

For me, waiting for the uranium market to turn from bear to bull can be done successfully by choosing companies that are able to weather the storm. What do I mean by this? Well, some uranium producers have protected themselves by hedging all or part of their sales books for the next year or so to ensure they can still operate.

Those with great properties, scalability in their production, locations in the right jurisdictions, the sales contract books to at least partially protect downside uranium price risk, and that are run by experienced and proven management will be the companies that survive and are the first to lead the bull market.

The uranium market may not change tomorrow or next week, but I do believe there is a bright future for this clean energy producing commodity.


It’s Gonna Be HUGE!

Let us take a look at one country in particular, a country which I believe will turn to more domestic production of uranium in the future, and to nuclear power for its clean energy production.

An American Ressainance in Uranium

If you’ve haven’t already guessed, the country I’m referring to is the United States, and as you can see from the table below, they are the world’s largest generator of nuclear power. Interestingly enough, however, they are only the world’s 9th largest uranium producer.

What does this mean? The United States is required to import the vast majority of their uranium needs, as can be seen in the table from the USA Energy Information Agency’s breakdown of the purchased uranium in years 2011 to 2015. Specifically, refer to the data in ‘purchased from foreign suppliers’ and you will see that the U.S. purchased the vast majority of their uranium from foreign entities in 2015.

Top 10 Nuclear Power Generating Countries
Source: International Energy Agency – 2016 Key World Energy Statistics – pg.17


Uranium Mine Production by Country
Source: World Nuclear Association
U.S. Uranium Purchases 2011 to 2015
Source: U.S. Energy Information Administration


Who did the United States import their uranium from? Take a look at the pie chart below:

U.S. Uranium Import Sources
U.S. Energy Information Administration

Source: U.S. Energy Information Administration

The effect that president elect Donald Trump will have on the American economy has yet to reveal itself. From the statements he made during his campaign, however, we know of a few things that could happen:

  • Re-negotiate North American Free Trade Agreement (NAFTA)
    • Canada is the U.S.’ #1 trading partner and its #1 supplier of uranium. If the re-negotiation adds a tariff to imported Canadian uranium, U.S. utilities will be looking internally for a cheaper source.
  • Relations with Russia
    • It’s hard to say where this will go, but if tensions were to increase with Russia, it’s my contention that their supply of uranium to the U.S. may end.  The same could be said for the former Soviet States, Kazakhstan and Uzbekistan.
  • Made in America
    • Trump’s platform was “to make America great again,” and my guess is that this will include producing more of their goods within their borders. In particular, I believe there will be a push to produce more uranium within the country, creating more jobs and more security of supply.


Energy Fuels, America’s Next Leader in Domestic Uranium Production

The push for further domestic production will start with one of North America’s largest domestic uranium companies Energy Fuels. Energy Fuels is a uranium producer headquartered in Lakewood, Colorado, and with its producing assets in the western part of the United States. Its primary operations are as follows:

    • White Mesa Mill (Utah) – Only licensed and operating conventional mill in the USA.
    • Nichols Ranch Processing Facility (Wyoming) – In-Situ Recovery (ISR) of uranium
    • Alta Mesa Project (Texas) – In-Situ Recovery (ISR) of uranium

Let’s take a look at the reasons I believe Energy Fuels is set to weather the bear market storm.

The Energy Fuels Team

The Energy Fuels team is led by President and Chief Executive Officer (CEO), Stephen P. Antony. Antony has led Energy Fuels since his appointment in 2010. He’s a graduate of the Colorado School of Mines, originally trained as an engineer. He also holds a Masters of Business Administration from the University of Denver.

Antony has been in the mining industry for 39 years, and his start in the uranium business was with the mining arm of Mobil Oil, where he developed the reclamation plan for Mobil’s El Mesquite ISR operation in Texas. His next years were spent in managerial roles with Energy Fuels Nuclear, where he held the position of Director of Technical Services and with Power Resources Inc., where he was Vice-President of Business Development. Antony then consulted for Cameco as they completed their due diligence on Power Resources before their take over. Finally, in 2005, Antony was back with Energy Fuels as Chief Operating Office (COO), in charge of all the day-to-day operations of the corporation, production and exploration.

Antony has a great mixture of technical and managerial experience, and with 39 years in the business, he is certainly in the right position at the helm of America’s largest domestic uranium company.

My personal work experience is in operations, so I’m probably a little biased in my belief that operations, next to the CEO, are  the most important positions at a company. Energy Fuels has split their head operational position into 2 Executive Vice-President (VP) roles.

First, Harold R. Roberts is VP of Conventional Operations. Roberts is a trained engineer, having graduated from Montana State University in 1975. He has held many operational type roles throughout his career, from operations oversight to project development, as well as executive positions with Denison Mines, as Executive VP of U.S. Operations, and Energy Fuels Nuclear as President. Roberts’ work experience sets him up well for his operational role at Energy Fuels.

Secondly, W. Paul Goranson is VP of ISR Operations. Goranson is a trained engineer and possesses both an undergraduate and a Master’s degree from Texas A&M. Goranson has 28 years of experience in the uranium industry. Before joining Energy Fuels, he held executive roles with Uranez Energy Corporation, where he was COO and Director, Cameco Resources, where he was President, Mestena Uranium LLC, where he was VP, and finally, Rio Algom Mining and Uranium Resource Inc, where he held senior positions.

Energy Fuels is led by a seasoned group of uranium professionals, giving the company a solid footing during these hard days in the uranium business. Their business plans have thus far kept Energy Fuels profitable, and have set them up well for the upcoming bull.

Making America Great Again

It’s widely thought that North America is one of the best places for mining investment in the world. This is with good reason, as in our present moment in history, North America provides mining companies with a good legal system, relatively stable politics and a reliable workforce.

President Elect Trump is a wild card of sorts, and time will tell whether his proclamations will result in triumph or disaster, or maybe both, depending on your perspective. Only weeks after his win, it appears general consensus is that nuclear power will get a boost from Trump’s presidency.

Although the future is cloudy, I do believe that North America is your best bet from a jurisdictional perspective for uranium investment. The first part of this article describes the reasons I believe American uranium companies in particular will prosper in the years ahead.

Let us take a look at Energy Fuels’ presence in the United States and why they present the best bang for your investment buck for the American uranium companies.


Energy Fuels Properties

Located in Utah, White Mesa Mill is a conventional operation and the only licensed and operational mill in the United States. For those who aren’t familiar with the nuclear fuel cycle, let’s take a quick look.

Nuclear Fuel Cycle
Nuclear Fuel Cycle

A mill is integral to the cycle because yellowcake is produced through the milling process. Without it, uranium ore can‘t be converted into uranium hexafloride.

Conventional Uranium Mining

The White Mesa Mill has a licensed capacity of 8 million pounds (Mlbs) of uranium per annum and is centralized within the area where Energy Fuel’s high grade uranium mines are located.  Also, it possesses separate circuits to process high-purity vanadium and an alternate feed circuit, which produces uranium from other uranium-bearing  materials (don’t come from conventional ore). The alternate feed circuits are supplying Energy Fuels with profits during a dismal uranium market and represent a huge advantage to Energy Fuels when compared to its competitors.

Some food for thought, vanadium is extensively used within the steel industry as an alloying element, and is also a part of new battery technology, as it’s used with lithium to produce a powerful, safe and reliable battery solution.

PUSH:  Some push going into 2017 is the income generated from Energy Fuel’s new alternate feed contract, which was announced on October 31, 2016.


Mine Sites

Energy Fuels has a wide range of properties throughout the western United States. Let’s look at the conventional properties, first. Conventional uranium mining means that they mine uranium ore in an open pit or underground. The White Mesa Mill is the centrepiece for these mines, as all of the ore is trucked to the mill for processing.

Canyon Mine

  • Conventional development property located in Arizona
  • Inferred resource of 1.6 Mlbs
  • Extensive high grade copper mineralization (averaging 8.75%) was found (News Release). The plan is to expand the scope of the evaluation of the Canyon deposit, as this new discovery has the potential to make the economics of the project even better.  The further exploration of this target comes at a cost, as seen in the Q3 results, but it’s well worth it in my opinion, as a high grade copper by-product from this uranium mine could add a ton of value.
  • Production could start as early as 2017, with the ore being shipped to White Mesa for processing

Sheep Mountain

  • Conventional development property located in Wyoming – Currently, permitting for surface and underground mining
  • Probable reserves of 18.4 Mlbs U3O8, Indicated resource of 30.3 Mlbs U3O8
  • With a proposed maximum output of 1.5 Mlbs per annum

Henry Mountains Complex

  • Conventional property located in Utah, with close proximity to the White Mesa Mill. The Tony M mine is on standby, but fully permitted, while the Bullfrog portion of the project is still in permitting
  • Indicated resource of 12.8 Mlbs U3O8 and an Inferred resource of 8.1 Mlbs U3O8

La Sal Complex

  • The La Sal Complex is made up of a series of uranium/vanadium mines in Utah. These include: Beaver, Pandora, La Sal, Energy Queen and Red Clock projects
  • Beaver and Pandora are fully permitted and developed
  • Currently on standby
  • Measured and Indicated resource of 4.1 Mlbs U3O8 and 21.5 Mlbs of vanadium, and an Inferred resource of 0.4 Mlbs U3O8 and 1.9 Mlbs of vanadium

Whirlwind

  • Uranium/vanadium mine located on the Colorado/Utah border.
  • Fully permitted and developed
  • Currently on standby
  • Indicated resource of 1.0 Mlbs U3O8 and 3.3 Mlbs vanadium, and an Inferred resource of 2.0 Mlbs U3O8 and 6.8 Mlbs vanadium

Daneros

  • A uranium mine located in Utah, close to White Mesa Mill
  • Fully permitted and developed
  • Currently on standby
  • Inferred resource of 0.7 Mlbs U3O8

Roca Honda

  • Conventional property located in New Mexico, but within trucking distance to the White Mesa Mill. The project is still in permitting
  • Measured and Indicated resource of 14.8 Mlbs U3O8 and an Inferred resource of 11.2 Mlbs U3O8
  • PEA describes 2.6 Mlbs of production per year

Wate

  • Conventional property located in Arizona, but is within trucking distance to the White Mesa Mill. The project is in permitting
  • Inferred resource of 1.1 Mlbs U3O8

Energy Fuels also has a couple of other conventional development properties that are on a smaller scale: Sage Plain and EZ Complex. Check out their details here


In-Situ Recovery (ISR) Operations

Energy Fuels operates and owns ISR operations in the western United States, giving the company a portion of their U3O8 at a very low cost of production.

Nichols Ranch ISR Mine and Plant

  • Located in the Powder River Basin, Wyoming
  • Hank, Jane Dough properties are a part of Nichols Ranch
  • Fully licensed
  • 2 Mlbs of U3O8 per annum capacity
  • Measured and Indicated resource of 2.8 Mlbs U3O8
  • Resource expansion possibilities

Alta Mesa ISR Mine and Plant

  • Located in Texas
  • Purchased earlier this year (Mestena acquisition)
  • Fully licensed
  • 1.5 Mlbs of U3O8 per annum capacity
  • Currently on standby
  • Measured and Indicated resource of 3.6 Mlbs and an Inferred resource of 16.8 Mlbs

Energy Fuel’s owns a few ISR development properties, which are: Reno Creek, West North Butte, North Rolling Pin, and Arkose Mining Venture. For more information on these properties, check this out.

In total, Energy Fuels covers all of the bases with their ISR and conventional mining properties. The ISR projects provide the company with a low cost source of U3O8, which is particularly important in today’s price environment.

Not only is Energy Fuels one of America’s largest domestic uranium companies, but it has the potential to get even larger with there being a possibility for an expandable resource at a number of their properties. Available multiple million pounds in the ground and the ability to produce U3O8 up to 11.5 Mlbs per year, Energy Fuels has the horse power to respond to the growing domestic demand for uranium in the years ahead.


Author’s Note

As I mentioned earlier, my work experience was in the steel manufacturing business, and after the economic calamity of 2008, production at the plant where I worked was cut by 50% and stayed that way up until last year. With an increasing gap between the Canadian and U.S. dollars, more production tons were shifted to our plant in Canada.

To some, adding 25% more production should be easy, just flick the switch. But, what’s overlooked is the plant’s labour force, which was laid off during the downturn, leaving the plant with a senior workforce (unionized, senior members weren’t laid off). The issue with this scenario is that when it came time to add an additional crew, we had to train new workers in record time and fill in for the slew of retirements that removed experienced workers from a workforce that was largely baby boomers.

My point is this, it’s fantastic that there’s room to grow as the market turns, however, it isn’t always as easy as flicking a switch, because laid off employees don’t always return, and training new employees can be complex, depending on the process.


Financials

On November 3rd, Energy Fuels announced its 3rd quarter results.

Antony stated in the news release:

 “In light of today’s uncertain uranium market, Energy Fuels is intently focused on preserving, and in the case of Canyon, enhancing the value of the Company’s uranium assets.  We feel that the Company is well placed in the global uranium sector with multiple, 100%-owned production opportunities, which collectively have the potential to produce a large quantity of low-cost uranium in diverse ways in an improved market.  Moreover, the Company is working diligently to strike the correct balance between growing our production capabilities, maintaining visibility in global uranium markets, advancing high-priority development and permitting activities, and sustaining the financial health of the Company.  We believe our new Business Plan will upgrade and improve the quality of our portfolio of, producing, and permitted assets, while also maintaining and improving Energy Fuels’ sustainability, so our shareholders are in a position to benefit from the expected uranium market recovery.”

Here’s a summary of the news release highlights:

  • Gross profit of $3.0 million USD from mining and milling operations (34% gross profit margin)
    • Energy Fuels has a sales contract book that runs until 2020. Starting next year, in 2017, and working towards 2020, they have fewer tons contractually sold each year. This strategy leaves them open to upside in the uranium price, while protecting against downside.
    • To note, Energy Fuels’ sales contracts are completed at fixed prices, therefore, allowing the company to predict future cash flows against current operating costs.
  • Recovered 350,000 pounds of U3O8 during the quarter, 90,000 lbs from ISR and 260,000 lbs from conventional sources.
  • Implementation of cost cutting measures such as: sale or abandonment of certain non-core properties, sale of excess mining equipment and the Board of Directors have decided to reduce their total compensation by 20%.
  • Energy Fuels has re-jigged some of their contract deliveries, moving 300,000 lbs that were originally scheduled for 2017 to November 15, 2016.
  • A net loss of $8.2 million USD, $1.4 million USD impairment of inventory, and $6.3 million USD of development (permitting and land holding costs)
    • Development costs were for well-field construction at Nichols Ranch and continued shaft-sinking at the Canyon project (evaluation of high grade copper discovery)
    • In a letter released September 22, 2016, CEO Stephen Antony discusses the current uranium market and why the company completed a 2nd financing ($15 million USD) this year. This letter is well worth the read, as Antony draws on his experience to explain current market dynamics and outlines where Energy Fuels is headed.  Personally, I like the direction in which they’re headed; development and acquisition of properties is best done when the demand for your product isn’t there, just like being a contrarian investor and buying in a down market. When the market turns, Energy Fuels will be ready to rock, with their best properties ready to produce uranium ore.


Energy Fuels’ 3rd quarter financial results are reflective of a dismal market, one in which they produced profits from an operational perspective, but because the company has chosen to march ahead with the development of their other high potential properties, has incurred a net loss.

Even if the market doesn’t turn, Energy Fuels has efficient conventional and ISR projects that should give the company a healthy metal spread in the years ahead. Along with the additional income from their alternate feed circuits, Energy Fuels is poised to stick around for the boom.


Comparison to its Peers

North American Uranium Producers

NOTE: MCAP numbers may have changed since the writing of this article, please do your own due diligence and check. All other analytics are from the company websites.

To get an idea of how Energy Fuels stacks up against its peers, take a look at the table above. In a simple calculation of MCAP to total (reserves and resources) uranium, Energy Fuels is clearly undervalued.  Other than Cameco, Energy Fuels has the most production upside capability, along with the largest total uranium resources, giving it the ability to capitalize to a greater extent on a change in market sentiment.


Cash Generation Calculation

Energy Fuels is licensed to produce 11.5 Mlbs of uranium per year. Current market conditions have forced the company to cut back production to around 1 Mlbs per year. Outside of their developments cost, Energy Fuels has the ability to generate cash through its operations.

  • 1st quarter gross profit margin of 33%, 2nd quarter gross profit margin of 18% and a 3rd quarter profit margin of 34%. Average Profit margin for the year 28%.
  • The White Mesa Mill has an annual capacity of 8 Mlbs, but for the sake of this calculation, let’s be conservative and say that full capacity during an up market is 5 Mlbs, or roughly 62.5% of capacity
  • The ISR plants (Nichols and Alta Mesa) have a cumulative capacity of 3.5 Mlbs per year; let’s use the same conservative estimate and say that at full capacity the ISR plants will produce 2.2 Mlbs per year.
  • Therefore, in total, Energy Fuels will produce 7.2 Mlbs in this hypothetical bull market scenario
  • For the sake of this calculation, let’s use today’s approximate average sale price of $55 USD per pound

7.2 Mlbs x 55 $ USD /lbs = $396,000,000 USD

$396,000,000 x 0.28 = $110,880,000 USD in operational cash generation


Now, to put this in perspective, Energy Fuels’ current MCAP is roughly $111 million USD and this conservative example shows a cash generation of $110.8 million USD. If you consider that a portion of Energy Fuels’ sales will be at higher prices in the coming bull market, this number grows quite easily. Also, this example assumes a 62.5% capacity utilization, which may or may not be conservative, but there’s certainly room to grow to Energy Fuels’ licensed capacity of 11.5 Mlbs.

As with the 3rd quarter results, Energy Fuels will have development and permitting costs to pay over the next few years, but this money is well spent as it will bring on more capacity, fuelling American nuclear reactors for years to come.


Buying Value at a Discount

Looking to invest in the uranium space but are lukewarm about when the bear market will end? While Energy Fuels isn’t without risk because they are spending cash in the midst of a bear market to purchase great properties and to further explore, permit and develop high potential properties, Energy Fuels, in my mind, is well worth a look – they boast the following strengths:

  • Experienced management team
  • Undervalued, MCAP to Resources Ratio, compared to their North American peers
  • They have a hedged sales contract book with orders confirmed to 2020. That said, not all of their production is contractually sold, giving them plenty of upside to a rising uranium price in the future.
  • Largest American uranium company by resource size
  • Production scalability –  with a license to produce 11.5 Mlbs per year, there’s plenty of upside to fulfill demand. Many properties have the potential to expand their resource without the need for M&A.
  • All operations are in the western United States

Energy Fuels is ready to fuel America’s uranium renaissance. Invest ahead of the crowd and be a contrarian!


Until next time,


Brian Leni   P.Eng

Founder – Junior Stock Review


Disclaimer: This is not an investment recommendation, it is an investment idea. I am not an investment professional and do not know your specific investment needs. Please do your own due diligence. I have not been compensated to write this article and do not own shares of Energy Fuels.